
Descrição
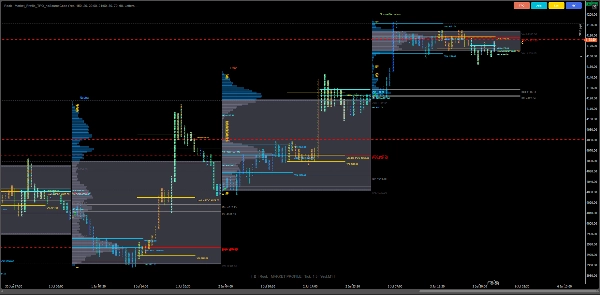
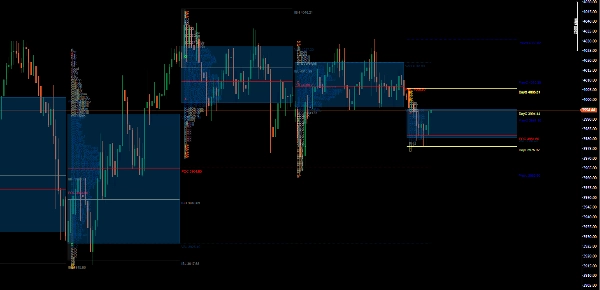
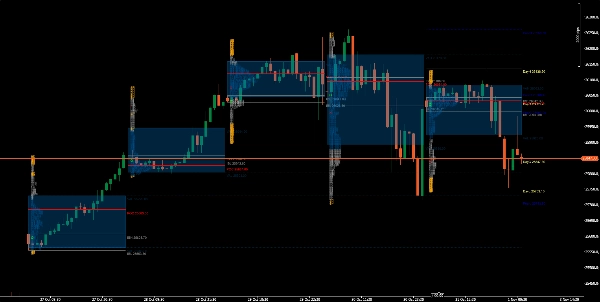
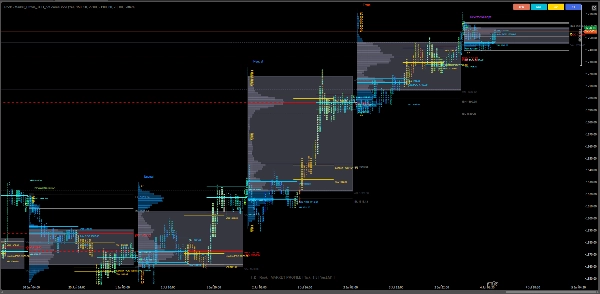
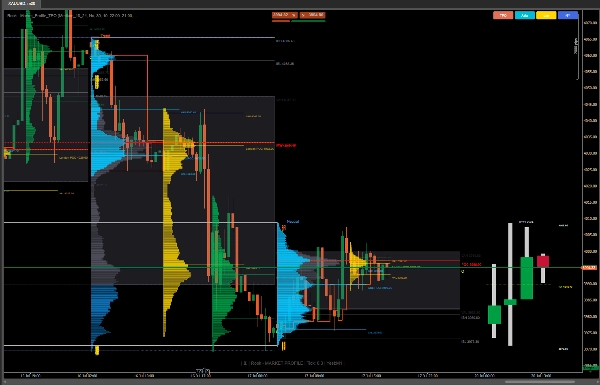
Market Profile TPO (Time Price Opportunity) traz visualização da estrutura de mercado em nível institucional para cTrader — permitindo que os traders vejam como preço, tempo e volume interagem entre sessões em uma única visão inteligente.
Projetado para traders profissionais de day trade, analistas de mercado de leilão e entusiastas do fluxo de ordens, este indicador oferece uma verdadeira representação da atividade do mercado usando letras TPO, caixas e histogramas. Ele ajuda a identificar áreas de valor, zonas POC, faixas de equilíbrio inicial e níveis nus com precisão exata.
⚙️ Recursos Principais
✅ Visualização (TPO)
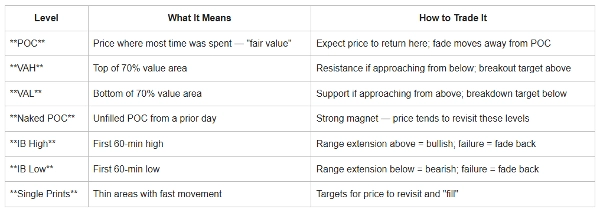
✅ Zonas POC e Área de Valor
✅ POC em desenvolvimento
✅ Detecção de Equilíbrio Inicial (IB)
✅ Inteligência de Sessão e Fuso Horário
✅ Modos de Exibição TPO (Letras / Histograma)
✅ Marcadores de Preço de Abertura/Fechamento (O/X)
✅ Impressões Únicas e Níveis Nus de POC/VA
✅ Sobreposição OHLC do Dia e do Dia Anterior
✅ Sobreposição OHLC do Dia e do Dia Anterior
✅ Projeção de Barra HTF (AMD)
Principais Melhorias
✔ Carregamento mais rápido
✔ Melhor gerenciamento de memória
✔ Cálculo preciso da Área de Valor
✔ Posicionamento correto do perfil da sessão
✔ Melhor desempenho do toggle
✔ Compatibilidade multiplataforma
✔ Sessões baseadas em UTC (sem DST automático)
✔ Melhor manuseio do POC nu
✔ Renderização aprimorada do perfil
🧭 Casos de Uso para Trading
🔹 Análise de Leilão Intradiária — Identifique onde o valor está se formando, migrando ou rompendo.
🔹 Negociações de Reversão POC e Valor — Alvo para retestes de equilíbrio ou extremos em desvanecimento.
🔹 Rompimentos do Equilíbrio Inicial — Identifique quando a sessão se expande além da faixa da primeira hora.
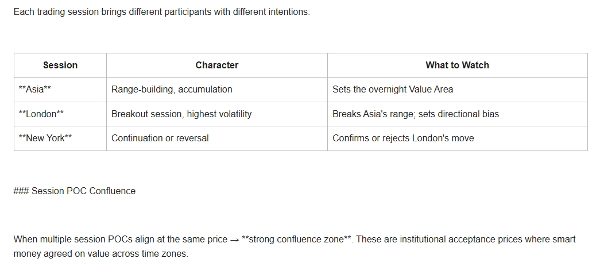
🔹 Estudo de Rotação de Sessão — Compare perfis entre as sessões da Ásia, Londres e Nova York com alinhamento de fuso horário.
🔹 Construção de Contexto Institucional — Combine com ferramentas de volume ou delta para validar pegadas de dinheiro inteligente.
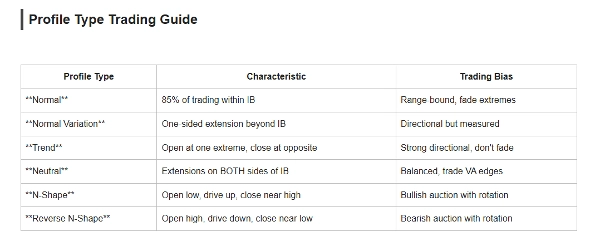
Tipos de Perfil
Tipo Condição de Mercado
Normal Mercado Balanceado
Variação Normal Tendência Moderada
Tendência Dia Direcional Forte
Neutro Leilão de Dois Lados
Leilão de Forma N de Alta
Leilão de Forma N Invertida de Baixa
Ideal Para
- Teoria do Mercado de Leilão (AMT)
- Traders de Market Profile
- Traders Intradiários
- Traders Swing
- Traders de Futuros
- Traders de Forex
- Análise Profissional de Fluxo de Ordens
Traga clareza institucional para seus gráficos.
O indicador Market Profile TPO transforma dados brutos de preço em uma história de valor, desequilíbrio e oportunidade
Aviso Legal: Este indicador é fornecido apenas para fins educacionais e informativos e não constitui aconselhamento financeiro, de investimento ou de negociação. Market Profile é uma ferramenta analítica e não garante lucros ou resultados futuros.
Negociar nos mercados financeiros envolve riscos substanciais, e o desempenho passado não garante resultados futuros. Os usuários são os únicos responsáveis por suas decisões de negociação, gerenciamento de risco e quaisquer lucros ou perdas resultantes.
Sempre realize sua própria análise e consulte um profissional financeiro qualificado antes de tomar decisões de investimento ou negociação.
Resumo
Key features include multiple TPO display modes (letters and histogram), session and timezone intelligence with UTC-based sessions, open/close price markers (O/X), single prints, naked POC/VA levels, and overlays of day and previous day OHLC data. The indicator supports analysis of various market conditions through profile types like Normal (balanced market), Normal Variation (moderate trend), Trend (strong directional day), Neutral (two-sided auction), N-Shape (bullish auction), and Reverse N-Shape (bearish auction).
It is suitable for professional day traders, auction market analysts, order flow enthusiasts, and traders across Forex, indices, and commodities markets. Typical use cases include intraday auction analysis, POC and value reversion trades, initial balance breakouts, session rotation studies, and institutional context building when combined with volume or delta tools.
This indicator provides a detailed, structured view of market dynamics to support informed trading decisions based on Auction Market Theory and Market Profile principles.
Avaliações de clientes
5 | 0 % | |
4 | 100 % | |
3 | 0 % | |
2 | 0 % | |
1 | 0 % |


![Logótipo de "[Hamster-Coder] Moving Average MTF"](https://cdn.ctrader.com/image/webp/b11b98b1-194d-4b8e-b00e-d611826ad159_31226)

