Beschreibung
Stellen Sie sich vor, Sie hätten einen professionellen Analysten direkt neben sich sitzen, der ständig Ihre Handelsbildschirme beobachtet und alle kritischsten Zonen in Echtzeit für Sie markiert. Genau das ist der Zweck unseres fortschrittlichen Multi-Timeframe-cTrader-Indikators. Speziell für Trader entwickelt, die der Inner Circle Trader- oder ICT-Methodik folgen, nimmt dieses Tool die schwere Arbeit der technischen Analyse ab. Es scannt automatisch den Markt, um grundlegende Smart-Money-Konzepte zu identifizieren und übersetzt komplexe Kursbewegungen in eine klare, leicht verständliche visuelle Karte. Anstatt Stunden damit zu verbringen, Linien und Kästchen manuell zu zeichnen, können Sie sich vollständig auf die Planung Ihrer Trades und das Risikomanagement konzentrieren.
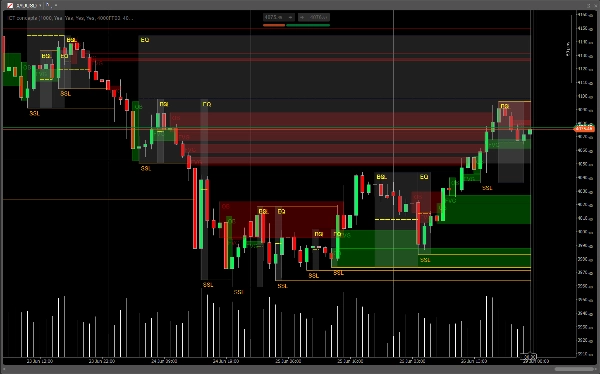
Der Indikator erkennt mühelos die Kernpfeiler der ICT-Strategie und präsentiert sie auf eine unglaublich leicht verständliche Weise. Er findet Fair Value Gaps, also Bereiche, in denen sich der Preis zu schnell bewegt hat und eine Lücke hinterlassen wurde, die der Markt normalerweise wieder besuchen und füllen möchte. Außerdem erkennt er Order Blocks, die spezifische Bereiche hervorheben, in denen große Finanzinstitute wahrscheinlich ihre massiven Trades vor einer großen Marktbewegung platziert haben. Darüber hinaus markiert er automatisch Kauf- und Verkaufs-Liquiditätspools. Dies sind im Wesentlichen Bereiche, in denen viele alltägliche Trader ihre Stop-Loss-Orders platziert haben, die wie ein Magnet für den Markt wirken. Schließlich berechnet er Gleichgewichts-Handelsbereiche, die den Markt sauber in Premium- und Discount-Hälften unterteilen, sodass Sie immer wissen, ob Sie zu einem günstigen Preis kaufen oder zu einem teuren Preis verkaufen.
Eine der größten Frustrationen bei den meisten automatisierten Handelstools ist, dass sie Ihren Chart schnell in ein unübersichtliches, verwirrendes Netz aus alten, nutzlosen Linien verwandeln. Wir haben dieses Problem durch die Entwicklung einer intelligenten integrierten Abschwächungs-Engine gelöst. In dem Moment, in dem der Preis eine Order Block berührt, eine Lücke vollständig füllt oder durch einen Liquiditätspool wischt, weiß der Indikator, dass die Zone „verbraucht“ ist. Er hört sofort auf, diese spezifische Form in die Zukunft weiterzuzeichnen, sodass Ihr Bildschirm perfekt sauber bleibt. Sie sehen nur die frischen, unberührten Zonen, die tatsächlich für die aktuelle Marktbewegung relevant sind.
Um Ihnen den ultimativen Vorteil zu verschaffen, verwendet dieses Tool ein leistungsstarkes Multi-Timeframe-Projektionssystem. Große Marktbewegungen werden von höheren Zeitrahmen bestimmt, aber die sichersten und präzisesten Trade-Einstiege erfolgen auf den niedrigeren. Dieser Indikator verankert sich nativ am äußerst zuverlässigen Fünfzehn-Minuten-Chart, um alle seine strukturellen Daten zu sammeln. Dann projiziert er diese wichtigen Fünfzehn-Minuten-Zonen fehlerfrei auf Ihre viel schnelleren Ein-Minuten-, Drei-Minuten- und Fünf-Minuten-Charts, ohne dass Sie zwischen verschiedenen Bildschirmen hin- und herklicken müssen. So können Sie Ihre Einstiege mit unglaublicher Präzision auf den schnellen Charts anvisieren und gleichzeitig beruhigt sein, weil Sie vollständig mit dem größeren, hochwahrscheinlichen institutionellen Trend übereinstimmen.