

present
ลงทะเบียนและรับส่วนลด $50 สำหรับการซื้อครั้งแรกของคุณ
Trading product for Impulse Matrix Pro อินดิเคเตอร์ Forex Signal, image 1
Impulse Matrix Pro
อินดิเคเตอร์
1 การซื้อ
เวอร์ชัน 1.0, Apr 2026
Windows, Mac
5.0
รีวิว: 3
Trading product for Impulse Matrix Pro อินดิเคเตอร์ Forex Signal, image 2
Trading product for Impulse Matrix Pro อินดิเคเตอร์ Forex Signal, image 3
Trading product for Impulse Matrix Pro อินดิเคเตอร์ Forex Signal, image 4
Trading product for Impulse Matrix Pro อินดิเคเตอร์ Forex Signal, image 5
Trading product for Impulse Matrix Pro อินดิเคเตอร์ Forex Signal, image 6
Trading product for Impulse Matrix Pro อินดิเคเตอร์ Forex Signal, image 7
ตั้งแต่ 03/10/2024
167
การขาย
40.98K
ติดตั้งฟรี

คำอธิบาย

Impulse Matrix Pro 🚀

มันคืออะไร?

https://chartshots.spotware.com/c/69d5282dc32e0

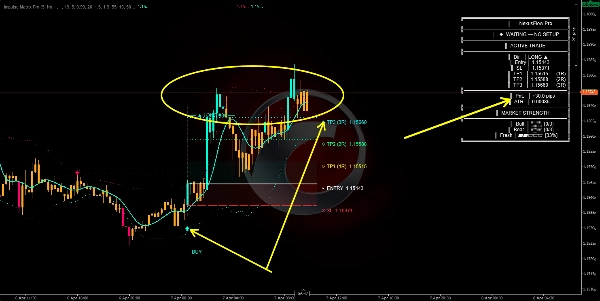
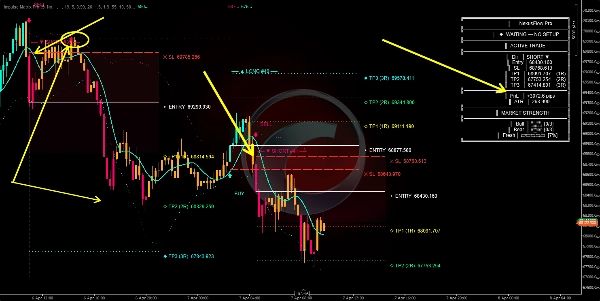
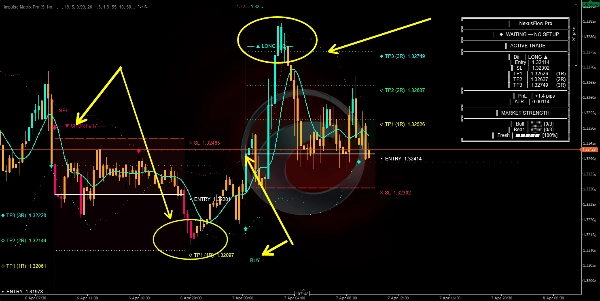
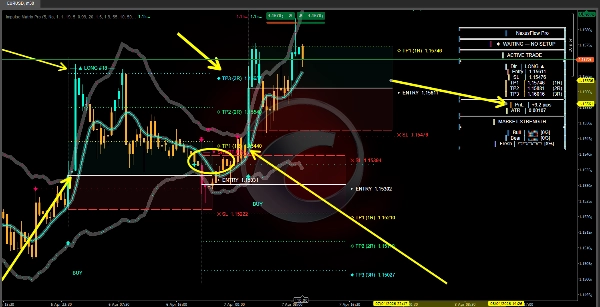
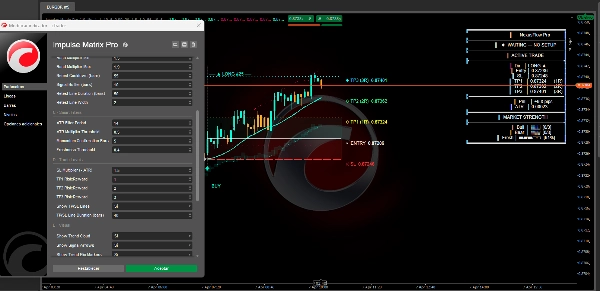
Impulse Matrix Pro เป็นตัวบ่งชี้แบบซ้อนที่สร้าง สัญญาณซื้อและขาย 📈📉 เฉพาะเมื่อ สามเครื่องยนต์อิสระ เห็นพ้องพร้อมกัน มันรวมการตรวจจับแนวโน้ม การทะลุแรงกระตุ้น และตัวกรองอัจฉริยะเข้าด้วยกันในระบบเดียวที่มีระดับการจัดการความเสี่ยงในตัว 🛡️.

https://chartshots.spotware.com/c/69d5293d873fa

สามเครื่องยนต์ ⚙️

https://chartshots.spotware.com/c/69d5288a347ea

เครื่องยนต์ 1 — แนวโน้ม (SMEMA) 🌊

ค่าเฉลี่ยเคลื่อนที่แบบเรียบสองชั้น (เอ็กซ์โพเนนเชียล → จากนั้นแบบง่าย) สร้าง เส้น Nexus.

  • ถ้ามันกำลังขึ้น → แนวโน้มเป็น ขาขึ้น 🟢.
  • ถ้ากำลังลง → ขาลง 🔴.

รอบ ๆ มัน, แถบซองจดหมาย 3 แถบ ถูกวาดขึ้นด้านบนและด้านล่าง โดยเว้นระยะด้วยช่วงเทียนเฉลี่ยที่เรียบ ค่าเงินที่สัมพันธ์กับแถบเหล่านี้กำหนด ความแข็งแกร่ง (0–3):

ความแข็งแกร่ง

ความหมาย

1/3

ราคานอกเหนือจากแถบ 1

2/3

ราคานอกเหนือจากแถบ 2

3/3

ราคานอกเหนือจากแถบ 3 ⚡

ความแข็งแกร่งขั้นต่ำที่สูงขึ้น = สัญญาณน้อยลงแต่ คุณภาพสูงกว่า

เครื่องยนต์ 2 — แรงกระตุ้น (BOSWaves)

ตรวจจับ เหตุการณ์การทะลุโครงสร้าง โดยใช้แถบไดนามิกที่สร้างจาก:

  • เส้นฐาน EMA
  • ค่าเบี่ยงเบนสัมบูรณ์เฉลี่ย (MAD) เป็นหน่วยความผันผวน

พฤติกรรมหลัก: แถบจะหดตัวหลังการเคลื่อนไหวที่รุนแรง (ทำให้ทริกเกอร์ง่ายขึ้น) และขยายตัวในช่วงการรวมตัว (ทำให้ทริกเกอร์ยากขึ้น) ซึ่งควบคุมโดยคะแนน ความสดใหม่ของแรงกระตุ้น ที่ลดลงตามเวลา ⏳.

  • การทะลุขาขึ้น: ราคาปิดก่อนหน้า ≤ แถบบน ราคาปิดปัจจุบันข้ามขึ้นเหนือมัน 🚀.
  • การทะลุขาลง: ราคาปิดก่อนหน้า ≥ แถบล่าง ราคาปิดปัจจุบันข้ามลงต่ำกว่า 📉.

เครื่องยนต์ 3 — ตัวกรองอัจฉริยะ 🛡️

สามประตูที่สัญญาณทุกตัวต้องผ่าน:

  • ความผันผวน ATR: ตลาดมีการเคลื่อนไหวเพียงพอสำหรับการเทรด 🌊
  • โมเมนตัม: ราคากำลังเคลื่อนที่ไปในทิศทางของสัญญาณจริง ๆ ในช่วง N แท่ง 🏃‍♂️
  • ความสดใหม่: แรงกระตุ้นยังไม่เสื่อมสภาพ — การเคลื่อนไหวยัง "มีชีวิต" 🔥

เงื่อนไขสัญญาณ 🚦

ซื้อ — ต้องเป็นจริงทั้งหมด 7 ข้อ:

  1. เส้น Nexus กำลังขึ้น
  2. ความแข็งแกร่งของขาขึ้น ≥ เกณฑ์ขั้นต่ำ
  3. ตรวจพบการทะลุขาขึ้นของแรงกระตุ้น
  4. ทิศทางเปลี่ยนจากขาลงเป็นขาขึ้น
  5. ผ่านตัวกรอง ATR
  6. โมเมนตัมยืนยันการเคลื่อนไหวขึ้น
  7. ความสดใหม่ของแรงกระตุ้นสูงกว่าเกณฑ์

ขาย — ต้องเป็นจริงทั้งหมด 7 ข้อ:

  1. เส้น Nexus กำลังลง
  2. ความแข็งแกร่งของขาลง ≥ เกณฑ์ขั้นต่ำ
  3. ตรวจพบการทะลุขาลงของแรงกระตุ้น
  4. ทิศทางเปลี่ยนจากขาขึ้นเป็นขาลง
  5. ผ่านตัวกรอง ATR
  6. โมเมนตัมยืนยันการเคลื่อนไหวลง
  7. ความสดใหม่ของแรงกระตุ้นสูงกว่าเกณฑ์

หมายเหตุ: หากเงื่อนไขใดเงื่อนไขหนึ่งล้มเหลว → ไม่มีสัญญาณ ❌.

ตรรกะการหยุดขาดทุน & ทำกำไร 📏

ทุกระดับเป็น อิงตาม ATR และปรับตัวได้เต็มที่ ตามความผันผวนปัจจุบัน 🔄.

  • ระยะหยุดขาดทุน = ATR × ตัวคูณ SL (ค่าเริ่มต้น 1.5)

ระดับ

การคำนวณ

อัตราส่วน R:R เริ่มต้น

SL

เข้า ∓ (ATR × 1.5)

— 🛑

TP1

เข้า ± (ระยะ SL × 1.0)

1:1 🎯

TP2

เข้า ± (ระยะ SL × 2.0)

1:2 🎯🎯

TP3

เข้า ± (ระยะ SL × 3.0)

1:3 💰

ตลาดผันผวน → หยุดและเป้าหมายกว้างขึ้น. ตลาดเงียบ → ระดับเข้มงวดขึ้น ทุกอย่างปรับขนาดโดยอัตโนมัติ ⚖️.

องค์ประกอบภาพ 🎨

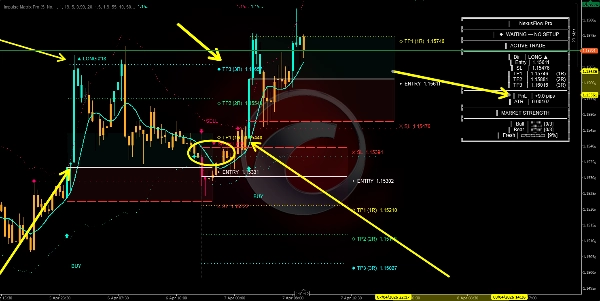
  • เส้น Nexus: ทิศทางแนวโน้มกลาง 🧵
  • แถบซองจดหมาย: โซนวัดความแข็งแกร่งพร้อมการไล่ระดับสีเติม 📊
  • แถบแรงกระตุ้น (จุด): เกณฑ์การทะลุไดนามิก 🏁
  • ลูกศรซื้อ / ขาย: สัญญาณเข้าที่ได้รับการยืนยัน 🏹
  • เพชรสีขาว: จุดเปลี่ยนแนวโน้มบนเส้น Nexus 💎
  • เส้นเข้า / SL / TP: ระดับการเทรดที่คาดการณ์ไว้ 📐
  • โซนสีแดง: พื้นที่ความเสี่ยง (จากเข้าไปยัง SL) ⚠️
  • โซนสีเขียว/ฟ้า: พื้นที่รางวัล (จากเข้าไปยัง TP1) 🏆
  • ดาว + เส้นแนวนอน: สัญญาณทดสอบซ้ำ — ราคากลับไปที่แถบแรงกระตุ้นโดยไม่ทะลุ ⭐
  • เมฆแนวโน้ม: เงาพื้นหลังละเอียดที่แสดงทิศทางหลัก ☁️
  • สีแท่ง: ฟ้า = ขาขึ้น · ชมพู = ขาลง · ส้ม = ไม่มีการตั้งค่า 🎨
  • แผงข้อมูล (มุมบนขวา): ข้อมูลการเทรดสด, กำไร/ขาดทุน, มาตรวัดความแข็งแกร่ง, เกจความสดใหม่ 🖥️

วิธีใช้ 📖

  1. รอลูกศรซื้อ/ขาย 🏹 — แท่งสีส้มหมายถึงไม่มีการตั้งค่า ให้ออกห่าง 🛑.
  2. ตรวจสอบแผงข้อมูล 🖥️ — ความแข็งแกร่งและความสดใหม่ที่สูงขึ้น = ความมั่นใจที่สูงขึ้น.
  3. เทรดตามระดับที่คาดการณ์ไว้ 📏 — SL ที่ระบุไว้, ทำกำไรบางส่วนที่ TP1/TP2, ปล่อยส่วนที่เหลือไปถึง TP3.
  4. ทดสอบซ้ำด้วยดาว ⭐ สามารถใช้เป็นโอกาสเพิ่มตำแหน่งในตำแหน่งที่มีอยู่.
  5. สัญญาณตรงกันข้าม 🔄 = การเทรดก่อนหน้าถูกยกเลิกแนวคิด.

พารามิเตอร์หลัก ⚙️

พารามิเตอร์

ค่าสูงกว่า

ค่าต่ำกว่า

รอบวัฏจักร

แนวโน้มเรียบกว่า สัญญาณช้ากว่า

เร็วกว่า ตอบสนองมากขึ้น ⚡

ความแข็งแกร่งขั้นต่ำ

สัญญาณน้อยลง ตัวกรองเข้มงวดขึ้น

สัญญาณมากขึ้น ตัวกรองน้อยลง 🔍

ความยาว EMA แนวโน้ม

เส้นฐานแรงกระตุ้นเรียบกว่า

ทะลุที่ตอบสนองมากขึ้น 🌊

ตัวคูณแถบ

แถบแรงกระตุ้นกว้างขึ้น ทะลุน้อยลง

แถบแคบลง ทะลุมากขึ้น 📏

เกณฑ์ ATR

ต้องการความผันผวนที่แรงขึ้น 🌪️

อนุญาตสัญญาณความผันผวนต่ำ

เกณฑ์ความสดใหม่

เฉพาะแรงกระตุ้นสดเท่านั้นที่ผ่านเกณฑ์ 🔥

อนุญาตแรงกระตุ้นที่เสื่อมสภาพ

ตัวคูณ SL

หยุดขาดทุนกว้างขึ้น 🛡️

หยุดขาดทุนแคบลง 🎯

อัตราส่วน TP

เป้าหมายที่ทะเยอทะยานมากขึ้น 💰

เป้าหมายที่อนุรักษ์นิยมมากขึ้น

ข้อจำกัดความรับผิดชอบ ⚠️

ตัวบ่งชี้นี้ ไม่ดำเนินการเทรด เป็นเครื่องมือวิเคราะห์ 🧠. ระดับ TP/SL เป็นคำแนะนำที่อิงความผันผวน ไม่ใช่การรับประกันราคา ทำงานได้ดีที่สุดใน สภาวะแนวโน้ม 📈. ควรรวมกับการวิเคราะห์โครงสร้างตลาดและการจัดการความเสี่ยงที่เหมาะสม.

สรุป

สรุปโดย AI
Impulse Matrix Pro is a trend-following overlay indicator that generates buy and sell signals only when three independent analytical engines concur simultaneously. It integrates trend detection, impulse breakout identification, and smart filtering into a unified system with built-in risk management based on adaptive ATR (Average True Range) levels.

The three engines include:
1. Trend (SMEMA) – uses a double-smoothed moving average called the Nexus Line to determine bullish or bearish trends and measures price strength via three envelope bands.
2. Impulse (BOSWaves) – detects break-of-structure events using dynamic bands derived from an EMA baseline and volatility measured by Mean Absolute Deviation, with an impulse freshness score that decays over time.
3. Smart Filters – apply volatility, momentum, and freshness criteria to validate signals.

Signals require all seven conditions per direction (buy or sell) to be met, ensuring confirmation from trend, strength, breakout, momentum, and volatility filters. Stop loss and take profit levels are ATR-based and automatically adjust to market volatility, supporting risk management with multiple target ratios.

Visual elements include trend lines, envelope and impulse bands, entry/exit markers, zones indicating risk and reward, and an info panel displaying live trade data. The indicator supports markets such as Forex, indices, stocks, and cryptocurrencies. It is designed for trending conditions and serves as an analytical tool without executing trades.
โปรไฟล์อินดิเคเตอร์
หมวดหมู่อินดิเคเตอร์
Trend
ประเภทเอาต์พุต
การแสดงเป็นภาพ
สัญญาณ
ตัวกรอง
ข้อกำหนดด้านข้อมูล
แท่งเท่านั้น
สัญญาณที่รองรับ
Breakout
ความผันผวน
แตะ Level ที่ระบุ
เบรก Level ที่ระบุ
ความแข็งแกร่งของแนวโน้ม

รีวิวจากลูกค้า

5.0
รีวิว: 3
5
100 %
4
0 %
3
0 %
2
0 %
1
0 %
รีวิวจากลูกค้า
April 18, 2026
April 15, 2026
The trade idea becomes clearer, but it is just a support layer.
April 11, 2026
The reason it feels usable is the chart feels less crowded, and a week of notes gives a better read.

การสนทนา

คำถามที่พบบ่อย

Forex
Signal
Breakout
Indices
Crypto
Stocks
ATR
ผลิตภัณฑ์ที่มีให้บริการผ่าน cTrader Store รวมถึงบอทการเทรด อินดิเคเตอร์ และปลั๊กอิน มีให้บริการโดยนักพัฒนาบุคคลที่สามและมีไว้เพื่อวัตถุประสงค์ในการเข้าถึงข้อมูลและทางเทคนิคเท่านั้น cTrader Store ไม่ใช่โบรกเกอร์และไม่ได้ให้คำแนะนำการลงทุน คำแนะนำส่วนบุคคล หรือการรับประกันผลการดำเนินงานในอนาคต

เพิ่มเติมจากผู้เขียนคนนี้

"ZigZag" โลโก้
เรตติ้งสูง
4.3
(6)
ฟรี
อินดิเคเตอร์
ATR
RSI
+7
ZigZag filters noise, spots trends, patterns, pivots, aiding analysis, trade management, and confirmations. 📉📈
"Order Block" โลโก้
ยอดนิยม
4.8
(5)
$19
อินดิเคเตอร์
ATR
RSI
+7
Identify bullish and bearish Order Blocks to spot key support/resistance levels and potential trend reversals! 📈🔄
"Volume POC Heatmap" โลโก้
เรตติ้งสูง
5.0
(4)
ฟรี
อินดิเคเตอร์
ATR
RSI
+7
📊 Shows volume by price levels, highlights POC, and key zones. Identifies dynamic support/resistance and imbalances.
"BOS & CHOCH" โลโก้
ยอดนิยม
5.0
(2)
$19
/
$25
อินดิเคเตอร์
ATR
RSI
+6
Market structural patterns , specifically the concepts of Change of Character (ChoCH) 🔄 and Break of Structure (BoS) 💥
"Auto-Trend Channel" โลโก้
เรตติ้งสูง
4.4
(5)
ฟรี
อินดิเคเตอร์
ATR
RSI
+6
Adaptive trend channel using linear regression and Pearson correlation for dynamic support, resistance, and trends.
อินดิเคเตอร์
RSI
Breakout
+1
"Identify key market zones and visualize support/resistance from multiple timeframes on a single chart.
"Fair Value Gap Sessions" โลโก้
เรตติ้งสูง
5.0
(4)
ฟรี
อินดิเคเตอร์
ATR
RSI
+7
identify and highlight temporary market inefficiencies known as "fair value gaps" 🚨 within specific trading Sessions.
"Supertrend" โลโก้
ยอดนิยม
4.3
(3)
$19
อินดิเคเตอร์
ATR
RSI
+6
💹 Define a price channel 📈 and determine trend direction (bullish 🟢 or bearish 🔴).
อินดิเคเตอร์
ATR
RSI
+6
📊Zones Supply & Demand: Identifies key price levels with high volume concentration, marking Supply/Demand Zones & Marke
อินดิเคเตอร์
RSI
BTCUSD
+5
Identify market structure effortlessly with swing highs, lows, CHoCH, and BOS levels for smart trading decisions! 📊🔍"
อินดิเคเตอร์
ATR
RSI
+8
Detects bullish and bearish divergences
อินดิเคเตอร์
Advanced price action tool that combines multiple technical analysis concepts

นอกจากนี้คุณยังอาจชอบ

อินดิเคเตอร์
Forex
BTCUSD
+10
🎯Smart Signals : Auto Buy/Sell alerts with dynamic TP/SL algorithm. 💡
"Oscillator Scanner" โลโก้
เรตติ้งสูง
4.7
(4)
$20
/
$39
อินดิเคเตอร์
ATR
RSI
+7
Track the Movement of Market Assets with an Oscillator Scanner in Real-Time!
อินดิเคเตอร์
BOS
Volume
+5
20/40/60-day IPDA lookback ranges, Premium/Discount/Equilibrium zones, and quarterly shift alerts — anchored to true dai
อินดิเคเตอร์
Fisher Transform with smoothing. Spot reversals and cycles with precision. Great for any market, any timeframe.
"Titan Pro" โลโก้
ยอดนิยม
4.3
(3)
$19
อินดิเคเตอร์
ATR
MACD
+15
Professional trading indicator: 5 cloud types, 9 ML engines, SMC Order Blocks, Pandas-TA & live dashboard.
อินดิเคเตอร์
RSI
Volume
+3
Auto-detects swings, Includes POC, Value Area (VAH/VAL), High Volume Nodes (HVN), Fibonacci retracement, and RSI overlay
อินดิเคเตอร์
Prop
Forex
+12
Identify and trade breakouts with Consolidation Zones! Visualize price consolidation areas for trading opportunities.
"Chandelier Exit" โลโก้
ยอดนิยม
4.3
(3)
$19
/
$20
อินดิเคเตอร์
ATR
Prop
+14
Optimize exits with Chandelier Exit! Visualize stop-loss points dynamically for improved trading precision and safety.
อินดิเคเตอร์
EMA
A visual signal backtester that simulates trades directly on your chart and scores strategy performance.
อินดิเคเตอร์
AI
BOS
+4
Golden Boom and Crash Spike Detector is a trading tool designed for Crash 300 and Boom 300 indices on M1 Timeframe.
"Swing Points" โลโก้
เรตติ้งสูง
4.5
(6)
$19
อินดิเคเตอร์
AI
SMC
+15
Multi-Timeframe Swing Points Indicator for cTrader that identifies swing highs and lows on both the current timeframe.
"QX SmartStructure" โลโก้
เรตติ้งสูง
4.7
(4)
$26
/
$50
อินดิเคเตอร์
AI
ATR
+26
SMC without the mess: Clean structure + auto-managing FVGs + MTF panel. Hard-right-edge, step size-based for any symbol.
อินดิเคเตอร์
BOS
EMA
+5
Directional volume heatmap: see if a price zone was built on buying or selling, not just how much.
อินดิเคเตอร์
Forex
The cTrader Market Sessions Alerts Indicator marks global sessions, highlights key levels, and sends real-time alerts.
"Zigzag Trend" โลโก้
เรตติ้งสูง
4.5
(4)
$25
/
$45
อินดิเคเตอร์
AI
ATR
+23
The ZigZag Trend is a market structure tool that filters out small price fluctuations and highlights major swing.
"UT Bot" โลโก้
ยอดนิยม
4.4
(5)
$19
/
$20
อินดิเคเตอร์
ATR
Forex
+11
Trend-following indicator with dynamic ATR-based trailing stop for precise entry/exit signals
"Pro Sniper_Algotrend" โลโก้
ยอดนิยม
4.0
(5)
$19
/
$38
อินดิเคเตอร์
ADX
ATR
+5
10 Factors. One Signal. Zero Guesswork.
อินดิเคเตอร์
ATR
Channel
Reversal Trap Probability Bands plots a dynamic volatility envelope around price & automatically detects "trap" reversal

ราคา

ตั้งแต่ 03/10/2024
167
การขาย
40.98K
ติดตั้งฟรี




























