
คำอธิบาย
เครื่องตรวจจับสวิง
จุดสวิงโครงสร้าง + Fibonacci Retracement + RSI
--------------------------------------------------
อินดิเคเตอร์ฟรี
ระบุสวิงโครงสร้าง ดูแนวโน้ม เทรดด้วยความสอดคล้อง
--------------------------------------------------
สิ่งที่อินดิเคเตอร์นี้ทำ
เครื่องตรวจจับสวิงจะระบุจุดสูงและต่ำของสวิงโครงสร้างโดยใช้การตรวจจับจุดสูงต่ำในพื้นที่ด้วยความลึกที่ตั้งค่าได้และการกรองการเบี่ยงเบนอัตโนมัติ
จากนั้นเชื่อมต่อสวิงด้วยเส้นแนวโน้ม ซ้อนทับระดับ Fibonacci retracement มาตรฐาน และแสดงค่าปัจจุบันของ RSI ใกล้ราคาปัจจุบัน
--------------------------------------------------
คุณสมบัติหลัก
- การตรวจจับจุดสวิง (ความลึกตั้งค่าได้)
- การเบี่ยงเบนอัตโนมัติ: การกรองโดยใช้ ATR ปรับตามกรอบเวลาทุกประเภท
- โหมดเบี่ยงเบนแบบพิกัดคงที่ (สำหรับการควบคุมด้วยตนเอง)
- เส้นแนวโน้มสวิง (สวิงขึ้นสีน้ำเงิน, สวิงลงสีส้ม)
- Fibonacci Retracement (0, 23.6, 38.2, 50, 61.8, 78.6, 100 เปอร์เซ็นต์)
- การซ้อนทับค่าของ RSI (ค่า RSI ปัจจุบันใกล้ราคา)
- สีที่ปรับแต่งได้
- ปรับแต่งประสิทธิภาพ (จำนวนแท่งสูงสุดที่วาด)
--------------------------------------------------
การเบี่ยงเบนอัตโนมัติ - คุณสมบัติหลัก
มีโหมดเบี่ยงเบนสองแบบให้เลือก:
- พิกัดคงที่: กำหนดระยะห่างพิกัดขั้นต่ำระหว่างสวิง
- แบบ ATR (อัตโนมัติ): การเบี่ยงเบนแบบไดนามิกตามความผันผวนปัจจุบัน
เหตุใดการเบี่ยงเบนอัตโนมัติจึงสำคัญ:
- M1 ถึง M5: เบี่ยงเบนแคบ (จับสวิงเล็กๆ)
- H1 ถึง H4: เบี่ยงเบนปานกลาง (จับโครงสร้าง)
- D1 ถึง MN1: เบี่ยงเบนกว้าง (จับสวิงใหญ่)
อินดิเคเตอร์จะปรับตัวโดยอัตโนมัติตามกรอบเวลาที่คุณใช้งาน ไม่ต้องปรับด้วยตนเองเมื่อเปลี่ยนกราฟ
ทำให้เครื่องตรวจจับสวิงใช้งานได้กับทุกกรอบเวลา — ตั้งแต่กราฟ 1 นาทีถึงกราฟรายเดือน
--------------------------------------------------
Fibonacci Retracement - คุณสมบัติหลัก
สำหรับสวิงที่เสร็จสมบูรณ์ล่าสุด อินดิเคเตอร์จะวาด:
- 0.0 เปอร์เซ็นต์ (จุดเริ่มต้นของสวิง)
- 23.6 เปอร์เซ็นต์
- 38.2 เปอร์เซ็นต์
- 50.0 เปอร์เซ็นต์
- 61.8 เปอร์เซ็นต์
- 78.6 เปอร์เซ็นต์
- 100.0 เปอร์เซ็นต์ (จุดสิ้นสุดของสวิง)
สลับเปิด/ปิดเส้นและป้ายกำกับ ทุกระดับมีการใช้สีเพื่อการอ้างอิงทางสายตาอย่างรวดเร็ว
--------------------------------------------------
การซ้อนทับ RSI - คุณสมบัติหลัก
ค่าปัจจุบันของ RSI จะแสดงใกล้ราคาพร้อมการใช้สี:
- สีแดง: RSI สูงกว่า 70 (ซื้อมากเกินไป)
- สีเขียว: RSI ต่ำกว่า 30 (ขายมากเกินไป)
- สีขาว: RSI ระหว่าง 30 ถึง 70 (เป็นกลาง)
สิ่งนี้ให้บริบทโมเมนตัมทันทีโดยไม่ต้องเปิดหน้าต่าง RSI แยกต่างหาก
--------------------------------------------------
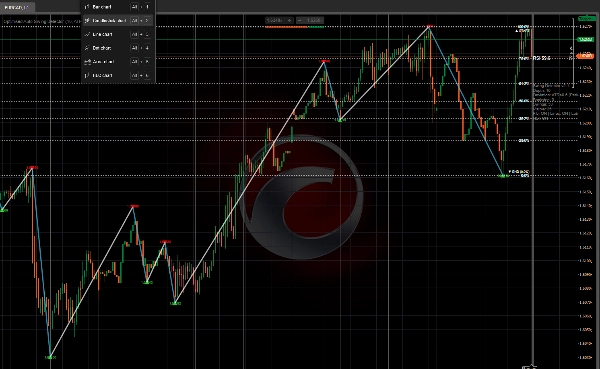
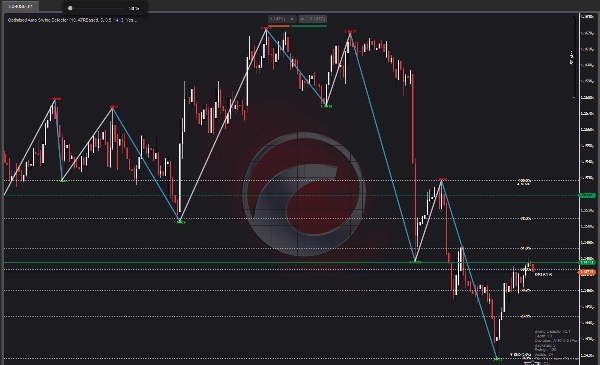
องค์ประกอบภาพ
- ลูกศรสีแดงลง = จุดสูงสุดของสวิง
- ลูกศรสีเขียวขึ้น = จุดต่ำสุดของสวิง
- เส้นสีน้ำเงิน = สวิงขึ้น (ต่ำไปสูง)
- เส้นสีส้ม = สวิงลง (สูงไปต่ำ)
- เส้นแนวนอนสีทอง = ระดับ Fibonacci
- ป้ายสีขาว = เปอร์เซ็นต์ Fibonacci
- ค่าของ RSI = RSI ปัจจุบันใกล้ราคา
- แผงข้อมูล = ความลึก, การเบี่ยงเบน, การถอยหลัง, จำนวนสวิง
--------------------------------------------------
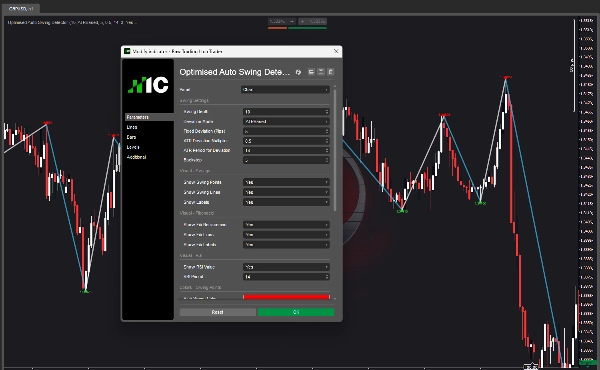
ภาพรวมพารามิเตอร์
การตั้งค่าสวิง:
- ความลึกของสวิง: จำนวนแท่งที่ตรวจสอบจุดสูงต่ำในพื้นที่
- โหมดเบี่ยงเบน: พิกัดคงที่หรือแบบ ATR (อัตโนมัติ)
- การเบี่ยงเบนคงที่: ระยะห่างพิกัดขั้นต่ำระหว่างสวิง
- ตัวคูณการเบี่ยงเบน ATR: ตัวคูณสำหรับการเบี่ยงเบนแบบ ATR
- ระยะเวลา ATR: ระยะเวลาสำหรับการคำนวณ ATR
- การถอยหลัง: จำนวนแท่งขั้นต่ำระหว่างสวิง
ภาพ - สวิง:
- แสดงจุดสวิง: สลับลูกศร
- แสดงเส้นสวิง: สลับเส้นแนวโน้ม
- แสดงป้ายกำกับ: สลับป้ายราคาต่างๆ
ภาพ - Fibonacci:
- แสดง Fib Retracement: สลับการซ้อนทับ Fibonacci
- แสดงเส้น Fib: สลับเส้นแนวนอน
- แสดงป้าย Fib: สลับป้ายเปอร์เซ็นต์
ภาพ - RSI:
- แสดงค่าของ RSI: สลับการซ้อนทับ RSI
- ระยะเวลา RSI: ระยะเวลาสำหรับการคำนวณ RSI
สี:
- สีสวิงสูง
- สีสวิงต่ำ
- สีเส้นสวิงขึ้น
- สีเส้นสวิงลง
- สีเส้น Fib
- สีข้อความ Fib
- สีป้าย RSI
ประสิทธิภาพ:
- จำนวนแท่งสูงสุดที่วาด: จำกัดการวาดเพื่อประสิทธิภาพที่เร็วขึ้น
--------------------------------------------------
กรณีการใช้งาน
- ระบุจุดสวิงโครงสร้างในทุกกรอบเวลา
- วาดเส้นแนวโน้มระหว่างสวิง
- ใช้ระดับ Fibonacci สำหรับการเข้าออกและเป้าหมายกำไร
- ยืนยันการเทรดด้วยความสอดคล้องของ RSI
- เข้าใจโครงสร้างตลาดได้อย่างรวดเร็ว
- เปลี่ยนกรอบเวลาโดยไม่ต้องปรับพารามิเตอร์ (การเบี่ยงเบนอัตโนมัติ)
--------------------------------------------------
ความสามารถในการใช้งานกรอบเวลา
เมื่อเปิดใช้งานการเบี่ยงเบนอัตโนมัติ อินดิเคเตอร์ทำงานได้ใน:
- M1, M5, M15 (การเทรดสั้น)
- M30, H1, H4 (การเทรดรายวัน)
- D1 (การเทรดสวิง)
- W1, MN1 (การเทรดตำแหน่ง)
อินดิเคเตอร์เดียว ทุกกรอบเวลา
--------------------------------------------------
อัปเกรดเป็นโซนความร้อนโครงสร้าง
อินดิเคเตอร์ฟรีนี้แสดงสวิงและโครงสร้างให้คุณ
โซนความร้อนโครงสร้างจะก้าวไปอีกขั้น — มันแผนที่ความเข้มข้นของการมีส่วนร่วม การยอมรับกับการปฏิเสธ และการมีส่วนร่วมของตลาดในหลายโซน
ค้นหาโซนความร้อนโครงสร้างในร้านค้า cTrader
--------------------------------------------------
อัปเกรดเป็น Invictus EA
Invictus EA ใช้เทคโนโลยีโครงสร้างเดียวกันเพื่อดำเนินการเทรดอัตโนมัติ
ค้นหา Invictus ในร้านค้า cTrader
--------------------------------------------------
บันทึกทางเทคนิค
- อินดิเคเตอร์ซ้อนทับ
- ทำงานบนทุกกรอบเวลาและสัญลักษณ์
- ไม่มีการวาดซ้ำ (สวิงเป็นข้อมูลย้อนหลัง)
- ปรับแต่งเพื่อประสิทธิภาพ
--------------------------------------------------
การสนับสนุน
รวมการอัปเดตตลอดชีพ
สำหรับข้อมูลเพิ่มเติม - คลิกโปรไฟล์นักพัฒนาด้านล่าง
สรุป
รีวิวจากลูกค้า
5 | 100 % | |
4 | 0 % | |
3 | 0 % | |
2 | 0 % | |
1 | 0 % |


