
Descrizione
Lo scopo di questo algoritmo cTrader dell'indicatore Boxify è cercare di inserire l'azione del prezzo in zone, o meglio, in box. In questo modo, il trader può ottenere un vantaggio sulle sue posizioni di trading. Non si tratta di un indicatore che può stare da solo, ma piuttosto di un utile strumento che può completare qualsiasi strategia o configurazione di trading.
Rilevare movimenti laterali può aiutare il trader a garantire profitti, tagliare le perdite o piazzare ordini limite a suo favore. Questi sono alcuni modi in cui possiamo usare un box:
Rilevare aree di consolidamento
Per i box passati che contengono diverse barre al loro interno, possiamo assumere con sicurezza che si tratta di aree di consolidamento e che abbiamo un movimento laterale. Queste aree possono servire come livelli di supporto o resistenza nella tua analisi dell'azione del prezzo.
Piazzare meglio i tuoi trade
Nel caso tu abbia una configurazione per un trade e vedi il prezzo in box, puoi sempre usare il box come linea guida per l'azione del prezzo, per ottenere una posizione più vantaggiosa per il tuo trade. Il box che si sta formando può essere usato sia per garantire alcuni profitti in una posizione vincente, rientrare in un mercato in trend o piazzare stop loss.
Piazzare ordini limite
Il lungo movimento laterale porterà infine a rotture. Boxify può aiutarti a piazzare ordini limite, sopra o sotto, per ottenere il massimo dall'inizio di una rottura.
Opzioni dell'indicatore
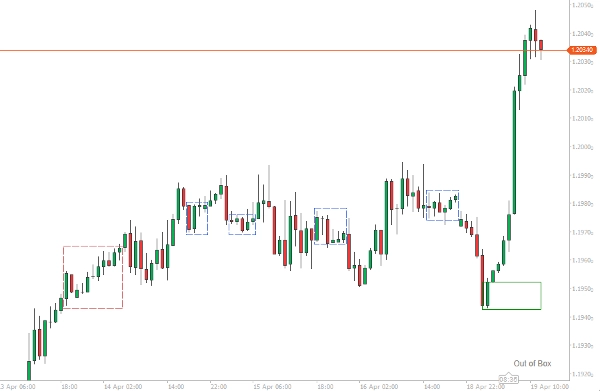
L'indicatore tenterà di racchiudere il prezzo da almeno 2 barre in su. I messaggi dell'indicatore appariranno nell'angolo in basso a destra dell'area del grafico.
- Se il prezzo è in trend, apparirà il messaggio “Out of Box”.
- Se il prezzo è in box, apparirà il messaggio “Boxing”.
- Se il prezzo è in box e il prezzo rompe il limite superiore, apparirà “Breaking High”.
- Se il prezzo è in box e il prezzo rompe il limite inferiore, apparirà “Breaking Low”.
I box sono considerati completi all'apertura di una nuova barra, poiché il prezzo può sempre rientrare nel box.
Barre Minime per il Box
Questo numero rappresenta il numero minimo di barre che un box deve avere per essere considerato completo. Usa numeri più bassi per i punti di ingresso e numeri più alti per le aree di consolidamento.
Filtro ATR
Boxify ha internamente un indicatore ATR, che puoi usare come opzione di filtro, nel caso tu voglia fermare la formazione del box su qualsiasi barra la cui lunghezza (High-Low) superi il valore ATR. Usa questa opzione se vuoi entrare nei trade.
Unisci Sovrapposizioni
L'inizio di un box può iniziare prima che il box precedente sia terminato (soprattutto se abbiamo selezionato un numero molto basso per la lunghezza del box). Possiamo unire questi box con questa opzione, così possiamo vedere la formazione di un box più grande – Questi box avranno un bordo di colore blu.
Tolleranza
Un numero che riflette la tolleranza che i limiti superiore/inferiore dei box possono avere. Numeri piccoli dovrebbero essere usati quando vogliamo entrare nei trade, numeri più grandi dovrebbero essere usati quando vogliamo trovare aree di consolidamento.
Riepilogo
Recensioni dei clienti
5 | 33 % | |
4 | 67 % | |
3 | 0 % | |
2 | 0 % | |
1 | 0 % |


