
VixFix
Indikator
Version 1.0, Jul 2025
Windows, Mac
4.0
Bewertungen: 1
Beschreibung
VixFix-Indikator für cTrader
Erfassen Sie Marktpanik, bevor sie in den Nachrichten erscheint.
Dieser VixFix-Indikator ist eine intelligente Anpassung des klassischen „VIX Fix“-Konzepts von Larry Williams – entwickelt, um Händlern zu helfen, kurzfristige Angst- und Volatilitätsspitzen zu erkennen, besonders nützlich zur Identifizierung von potenziellen Markttiefs.
Funktionsweise
- Berechnet eine Pseudo-Volatilitätsspitze, indem das jüngste Tief mit dem höchsten Hoch über einen konfigurierbaren Zeitraum (Standard: 12) verglichen wird.
- Wendet einen gleitenden Durchschnitt und eine Standardabweichungs-Hülle an, um Signalschwankungen vom normalen Rauschen zu trennen.
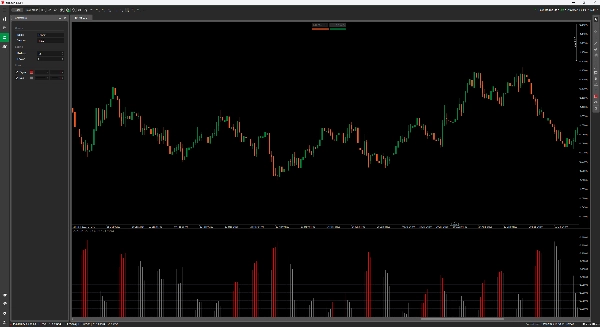
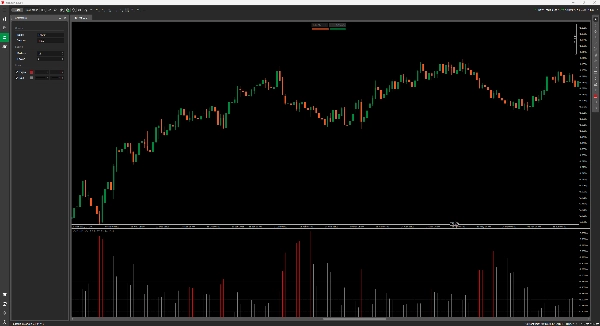
- Zeichnet rote Histogrammbalken, wenn die Volatilität den Schwellenwert überschreitet – Ihr Signal, aufmerksam zu werden.
Eigenschaften
- Saubere Histogrammanzeige (kein Overlay)
- Zweifarbige Darstellung:
-
- Rot = Signal (Volatilitätsspitze über dem Schwellenwert)
- Grau = Normale Aktivität
- Anpassbare Perioden und Sensitivitätsfaktor
- Kein Indikator-Verzögerung – verwendet nur Rohpreisbewegungen, kein Repainting
Anwendungsfälle
- Erkennen von potenziellen Umkehrungen in Abwärtstrends
- Timing von Mean-Reversion-Trades
- Bestätigung von überverkauften Bedingungen ohne Abhängigkeit von RSI oder anderen verzögerten Tools
Zusammenfassung
Indikatorprofil
Kundenbewertungen
4.0
Bewertungen: 1
5 | 0 % | |
4 | 100 % | |
3 | 0 % | |
2 | 0 % | |
1 | 0 % |
Diskussion
Häufig gestellte Fragen (FAQ)
Über den cTrader Store verfügbare Produkte, einschließlich Handelsbots, Indikatoren und Plugins, werden von externen Entwicklern bereitgestellt und nur zu Informations- und technischen Zugriffszwecken verfügbar gemacht. cTrader Store ist kein Broker und erbringt keine Anlageberatung, persönlichen Empfehlungen oder eine Garantie für zukünftige Performance.


Preis
Seit 03/01/2025
638.03K
Gehandeltes Volumen
21.34K
Pip-Gewinn
15
Verkäufe