
Descrizione
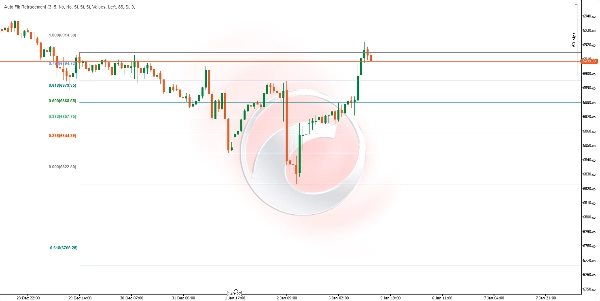
https://chartshots.spotware.com/c/695bff3f3bc21
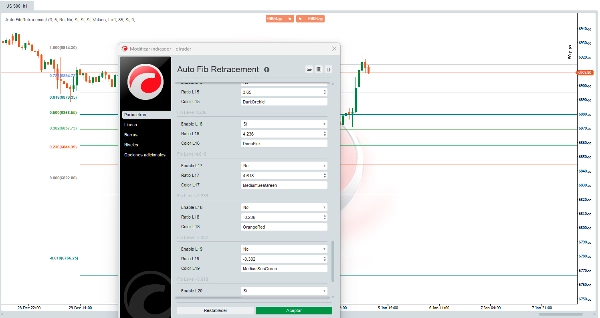
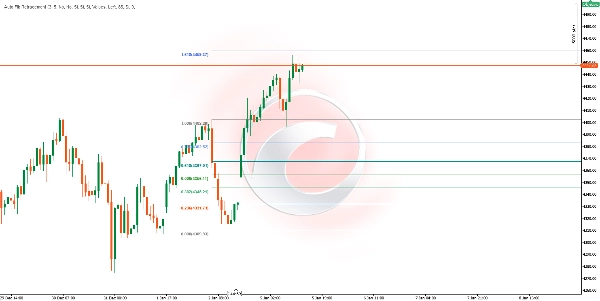
https://chartshots.spotware.com/c/695bffac03fb1
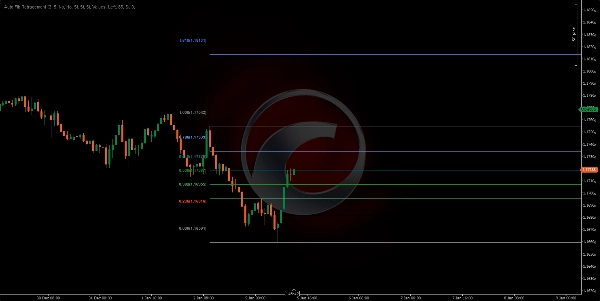
https://chartshots.spotware.com/c/695c0002aabb7
📊 Auto Fib Retracement
Auto Fib Retracement è un indicatore di analisi tecnica che traccia automaticamente i livelli di ritracciamento ed estensione di Fibonacci basandosi sui movimenti di prezzo più recenti e significativi. A differenza degli strumenti manuali di Fibonacci, questo indicatore rileva automaticamente i punti di svolta del mercato e aggiorna i livelli in tempo reale.
⚙️ Come Funziona?
Rilevamento Automatico dei Pivot
L'indicatore utilizza un algoritmo ZigZag dinamico per identificare i massimi e minimi significativi dei prezzi:
- Lookback (Profondità): Definisce quante barre vengono analizzate a ritroso per confermare un punto pivot. Un valore più alto rileva oscillazioni più ampie; un valore più basso è più sensibile a movimenti minori.
- Sensibilità (Deviazione): Controlla quanto deve essere significativo un movimento di prezzo per formare un nuovo pivot. Viene calcolato moltiplicando l'ATR a 10 periodi (Average True Range) per questo fattore. Valori più alti filtrano il rumore e rilevano solo movimenti importanti.
Calcolo dei Livelli di Fibonacci
Una volta identificati gli ultimi due pivot (un massimo e un minimo), l'indicatore calcola ogni livello usando la formula classica di Fibonacci:
Livello = Prezzo Ancora + (Intervallo di Movimento × Rapporto di Fibonacci)
Dove:
- Prezzo Ancora: Il prezzo del pivot più recente (o quello precedente se la direzione si inverte)
- Intervallo di Movimento: La differenza tra i due pivot
- Rapporti Disponibili: 0, 0.236, 0.382, 0.5, 0.618, 0.65, 0.786, 1, 1.272, 1.414, 1.618, 1.65, 2.618, 2.65, 3.618, 3.65, 4.236, 4.618, e livelli negativi (-0.236, -0.382, -0.618, -0.65)
📈 A Cosa Serve?
UseDescription
Identificare Supporti e Resistenze
I livelli 0.382, 0.5, e 0.618 sono zone classiche dove il prezzo tende a reagire 🔵
Definire Obiettivi di Prezzo
I livelli di estensione (1.618, 2.618, 3.618, 4.236) aiutano a proiettare quanto lontano potrebbe spingersi un movimento 🎯
Pianificare Entrate
Cerca ritracciamenti verso livelli chiave per entrare nella direzione del trend ⬆️⬇️
Impostare Stop-Loss
Posiziona gli stop oltre i livelli di Fibonacci rilevanti 🛑
Confermare Zone di Inversione
Quando il prezzo raggiunge livelli di estensione estremi, può indicare esaurimento 🔄
🛠️ Come Usarlo
Parametri Principali
ParametroDescrizioneValore Suggerito
Sensibilità
Moltiplicatore di deviazione per filtrare movimenti minori
3 (default)
Lookback
Numero minimo di barre per calcolare i pivot
10 (default)
Inverti Direzione
Inverte il punto di riferimento per il calcolo dei livelli
Disabilitato
Opzioni di Visualizzazione
OpzioneFunzione
Estendi Sinistra / Destra
Estende le linee orizzontali a sinistra o a destra del grafico
Mostra Prezzi
Mostra il prezzo esatto di ogni livello
Mostra Rapporti
Mostra il rapporto di Fibonacci (valori o percentuale)
Posizione Etichetta
Posiziona le etichette a sinistra o a destra
Opacità Zona
Controlla la trasparenza delle zone colorate tra i livelli
Livelli di Fibonacci Configurabili
Ognuno dei 22 livelli può essere:
- Attivato o disattivato individualmente
- Modificato nel suo valore numerico
- Cambiato nel colore
💡 Interpretare le Zone
Le zone colorate tra livelli consecutivi facilitano l'identificazione visiva:
- Zone Verde/Blu (0.382 - 0.786): Area di ritracciamento sano nei trend. Zona comune per cercare entrate. ✅
- Zona Livello 1.0: Rappresenta il 100% del movimento precedente. Funziona come supporto/resistenza chiave. ⚖️
- Zone Rosse/Rosa (1.618+): Estensioni del movimento. Il prezzo che raggiunge queste zone può indicare un eccesso di estensione. ⚠️
⚠️Considerazioni
- L'indicatore si aggiorna automaticamente quando rileva nuovi pivot significativi
- Funziona su qualsiasi timeframe e asset finanziario
- I livelli di Fibonacci sono zone di probabilità, non garanzie
- Si consiglia di usarlo in congiunzione con altri indicatori o analisi del price action
- Nei mercati laterali o volatili, i pivot possono cambiare frequentemente
📝 Note Tecniche
- L'ATR a 10 periodi viene usato internamente per calcolare la soglia dinamica per il rilevamento dei pivot
- L'indicatore richiede un dati storici minimi equivalenti al doppio del parametro Lookback per funzionare correttamente
- Linee e zone vengono ridisegnate solo sull'ultima barra per ottimizzare le prestazioni 🚀
Riepilogo
The indicator helps traders identify potential support and resistance zones, define price targets, plan entries on pullbacks, set stop-losses beyond key levels, and confirm reversal zones when price reaches extreme extensions. It works on any timeframe and financial asset, including Forex, stocks, commodities, indices, and cryptocurrencies such as BTCUSD, EURUSD, GBPUSD, XAUUSD, NAS100, and others.
Users can customize parameters like sensitivity, lookback period, direction inversion, and display options (line extension, price and ratio labels, zone opacity, and colors). Colored zones visually highlight key Fibonacci areas for easier interpretation. The indicator updates automatically with new pivots and redraws levels on the latest bar to optimize performance.


![Logo di "[Hamster-Coder] Bollinger Bands"](https://cdn.ctrader.com/image/webp/21d8e5d6-fb11-4bac-b9ee-cd05c2b76804_30327)


