설명
고급 가격 수준 지표
독특한 기능
다층 가격 시스템
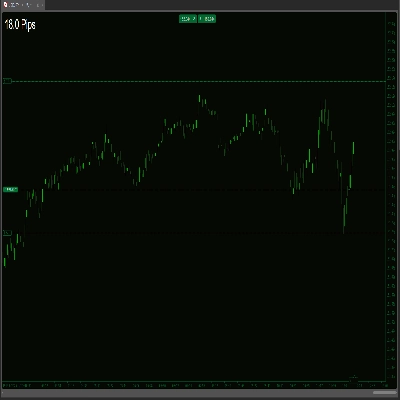
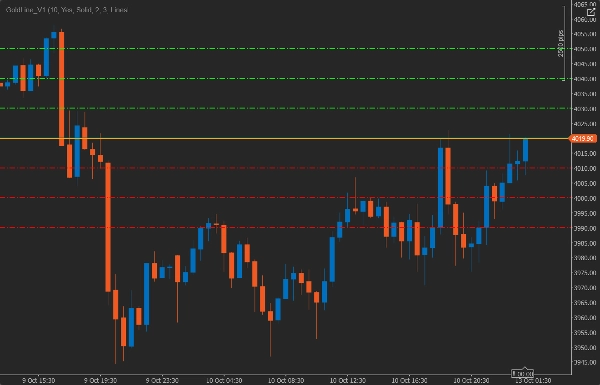
- 현재 추세 가격선 - 가장 가까운 주요 수준의 정확한 표시
- 완전 맞춤 설정 - 각 선의 독립적인 색상, 두께 및 스타일
전문 기능
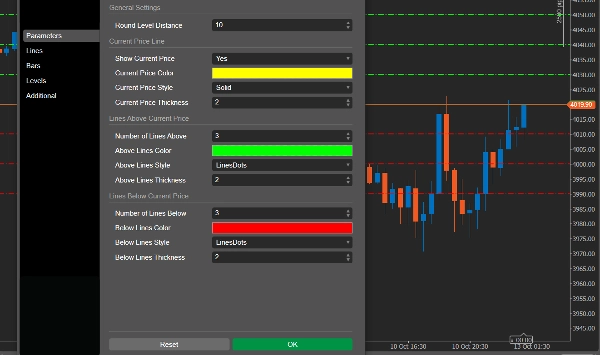
각 선 그룹에 대한 고급 설정
- 조절 가능한 수준 간격 (1에서 100 단위)
- 상하 선 수 (0에서 20선)
- 스마트 메모리 관리 및 자동 정리
🎨시각적이고 사용자 친화적인 디자인
- 각 선 그룹마다 다른 색상 구성표
- 다양한 스타일 (실선, 점선, 대시선)
- 조절 가능한 두께 (1에서 5 픽셀)
🚀 거래 응용
- 특히 금 거래에서 주요 가격 수준을 빠르게 식별
- 정확한 진입 및 퇴출 지점 결정
- 명확한 수준을 통한 위험 관리
- 거래 범위 식별
- 가격 반전 지점 예측
- 정밀한 거래 타이밍
- 중요한 수준의 즉각적인 관찰
- 수준에 기반한 빠른 의사결정
- 이익 실현 및 손절 지점 최적화
왜 이 지표를 선택해야 하나요?
"금융 시장에서 의사결정의 속도와 정확성은 수익성과 같습니다. 이 지표는 모든 트레이더가 필요로 하는 빠르고 정확한 도구입니다."
결론
- 시간 절약
- 높은 정확도 - 수준은 정밀한 수학에 기반해 계산됩니다
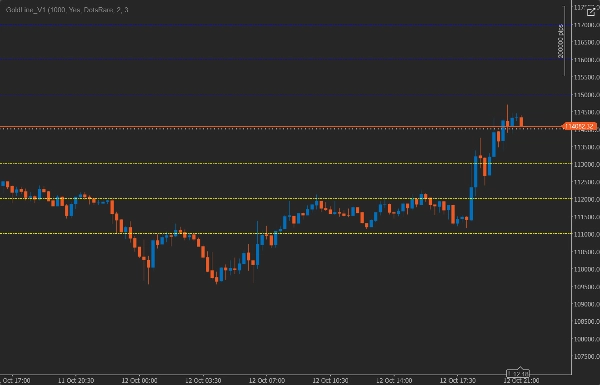
- 유연성 - 모든 타임프레임과 다양한 통화 쌍에 사용 가능
شاخص سطوح قیمت پیشرفته
ویژگیهای منحصر به فرد
سیستم قیمت چند لایه
- خط قیمت روند فعلی - نمایش دقیق نزدیکترین سطح کلیدی
- تنظیمات کاملاً قابل تنظیم - رنگ، ضخامت و سبک مستقل هر خط
ویژگیهای حرفهای
تنظیمات پیشرفته برای هر گروه خط
- فاصله سطوح قابل تنظیم (1 تا 100 واحد)
- تعداد خطوط بالا و پایین (0 تا 20 خط)
- مدیریت حافظه هوشمند و تمیز کردن خودکار
🎨طراحی بصری و کاربرپسند
- طرح رنگی متفاوت برای هر گروه خط
- سبکهای مختلف (خط ممتد، خط نقطه چین، خط چین)
- ضخامت قابل تنظیم (1 تا 5 پیکسل)
🚀 برنامههای معاملاتی
- شناسایی سریع سطوح کلیدی قیمت، به ویژه در معاملات طلا
- تعیین دقیق نقاط ورود و خروج
- مدیریت ریسک با سطوح واضح
- شناسایی محدودههای معاملاتی
- پیشبینی نقاط بازگشت قیمت
- زمانبندی دقیق معاملات
- مشاهده آنی سطوح مهم
- تصمیمگیری سریع بر اساس سطوح
- بهینهسازی نقاط حد سود و حد ضرر
چرا این شاخص را انتخاب کنیم؟ «در بازارهای مالی، سرعت و دقت تصمیمگیری برابر با سودآوری است. این اندیکاتور دقیقاً همان ابزار سریع و دقیقی است که هر معاملهگری به آن نیاز دارد.»
نتیجهگیری:
- صرفهجویی در زمان
- دقت بالا - سطوح بر اساس ریاضیات دقیق محاسبه میشوند
- انعطافپذیری - قابل استفاده در تمام تایمفریمها و جفت ارزهای مختلف
요약
The indicator supports smart memory management with automatic cleaning to maintain performance. Visually, it offers distinct color schemes for different line groups, enhancing clarity and user-friendliness.
Trading applications include rapid identification of key price levels—particularly useful in gold trading (XAUUSD)—accurate determination of entry and exit points, risk management, trading range identification, price reversal prediction, precise trade timing, and optimization of take profit and stop loss levels. It facilitates quick decision-making by providing instantaneous observation of important levels.
GoldLine_V1.2 aims to save time and improve accuracy by calculating levels based on precise mathematics, offering flexibility for use on various timeframes and markets including Forex, commodities, and cryptocurrencies such as BTCUSD and EURUSD.