
Descrizione
L'indicatore TrendFibonacci è progettato per aiutare i trader a identificare con precisione livelli di prezzo critici e tendenze di mercato. Integrando i livelli di ritracciamento di Fibonacci con una Media Mobile Ponderata (WMA) e l'Average True Range (ATR), questo indicatore fornisce una rappresentazione visiva chiara di supporto, resistenza e direzione della tendenza.
Caratteristiche principali:
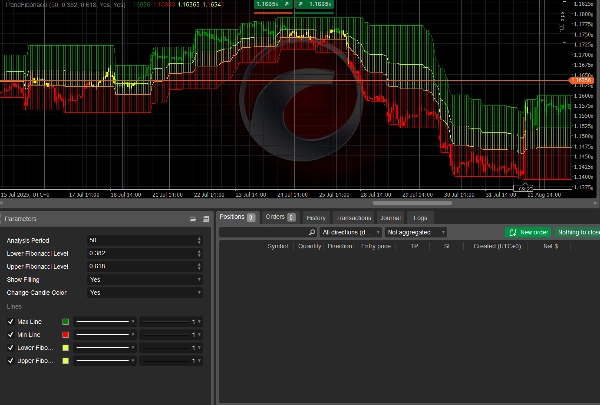
- Livelli di Fibonacci Dinamici: Calcola e traccia automaticamente i livelli di ritracciamento di Fibonacci (predefiniti: 0,382 e 0,618) basandosi sul massimo più alto e sul minimo più basso in un periodo di lookback definito dall'utente.
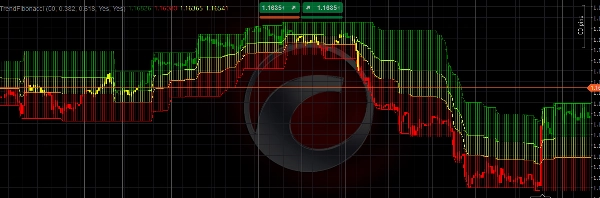
- Media Mobile Ponderata (WMA): Utilizza una WMA a 6 periodi per valutare la direzione della tendenza, con candele codificate a colori (Verde per rialzista, Rosso per ribassista, Giallo per neutro) per riflettere la posizione della WMA rispetto ai livelli di Fibonacci.
- Parametri Personalizzabili: Regola il periodo di analisi, i livelli di Fibonacci e attiva/disattiva funzionalità come le zone riempite e il cambio colore delle candele.
- Chiarezza Visiva: Traccia linee di massimo/minimo e riempie le aree tra i livelli di Fibonacci con colori semi-trasparenti per facilitare l'identificazione della tendenza.
- Integrazione ATR: Integra un ATR a 200 periodi per un'analisi di mercato robusta, garantendo adattabilità alla volatilità.
Questo indicatore è ideale per i trader che desiderano combinare l'analisi di Fibonacci con strategie di trend-following. Che tu stia facendo trading su forex, azioni o materie prime, TrendFibonacci migliora la tua capacità di individuare zone chiave di inversione e prendere decisioni di trading informate.
Come Usare
- Installa l'Indicatore:
-
- Aggiungi l'indicatore TrendFibonacci alla tua piattaforma cTrader caricando il codice sorgente o scaricandolo dal marketplace.
- Configura i Parametri:
-
- Periodo di Analisi: Imposta il periodo di lookback (predefinito: 50 barre) per determinare l'intervallo per il calcolo dei prezzi massimo/minimo.
- Livello Inferiore di Fibonacci: Regola il livello inferiore di ritracciamento di Fibonacci (predefinito: 0,382).
- Livello Superiore di Fibonacci: Regola il livello superiore di ritracciamento di Fibonacci (predefinito: 0,618).
- Mostra Riempimento: Abilita/disabilita le zone riempite tra i livelli di Fibonacci (predefinito: abilitato).
- Cambia Colore delle Candele: Abilita/disabilita le candele codificate a colori in base alla posizione della WMA (predefinito: abilitato).
- Interpreta l'Indicatore:
-
- Candele Verdi: Indicano una tendenza rialzista quando la WMA è sopra il livello superiore di Fibonacci.
- Candele Rosse: Segnalano una tendenza ribassista quando la WMA è sotto il livello inferiore di Fibonacci.
- Candele Gialle: Suggeriscono una zona neutra quando la WMA è tra i livelli di Fibonacci.
- Zone Riempite: Visualizzano zone chiave di prezzo tra le linee di massimo/minimo e i livelli di Fibonacci per l'analisi di supporto/resistenza.
- Applicazione nel Trading:
-
- Usa l'indicatore per identificare potenziali punti di ingresso/uscita ai livelli di Fibonacci.
- Combina con altri strumenti tecnici (es. RSI, MACD) per conferma.
- Monitora le candele codificate a colori per valutare la forza e la direzione della tendenza.
- Buone Pratiche:
-
- Testa l'indicatore su un conto demo per familiarizzare con il suo comportamento.
- Regola i parametri per adattarli al tuo stile di trading e alle condizioni di mercato.
- Usalo su timeframe più alti (es. H1, H4) per segnali più affidabili.
L'indicatore TrendFibonacci è uno strumento versatile per trader di tutti i livelli, offrendo intuizioni chiare e pratiche sulle tendenze di mercato e i livelli di prezzo.
Riepilogo
Users can customize parameters such as the analysis period, Fibonacci levels, and visual features like filled zones between Fibonacci levels and candle color changes. The indicator visually highlights support and resistance zones by plotting high/low lines and filling areas between Fibonacci levels with semi-transparent colors. It is applicable across various markets including forex, stocks, commodities, and popular symbols like BTCUSD, EURUSD, GBPUSD, and XAUUSD.
TrendFibonacci supports traders in spotting potential entry and exit points at Fibonacci levels and can be combined with other technical tools like RSI and MACD for confirmation. It is recommended for use on higher timeframes (e.g., H1, H4) to enhance signal reliability.


![Logo di "Trend Angle Indicator [Iridio Capital]"](https://cdn.ctrader.com/image/webp/28a98496-3412-4fea-82eb-be3347bdd6f1_27612)


