
Beschreibung
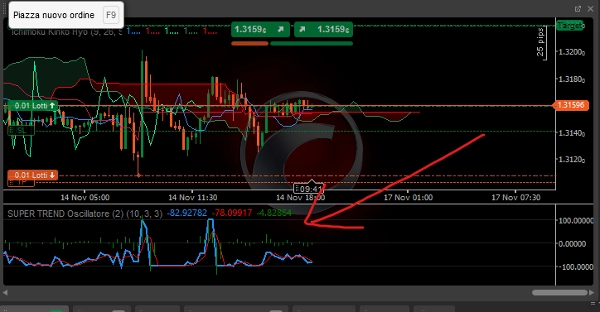
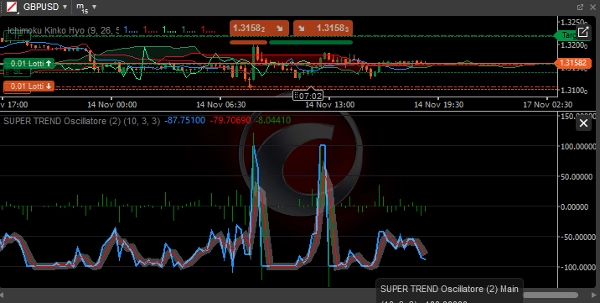
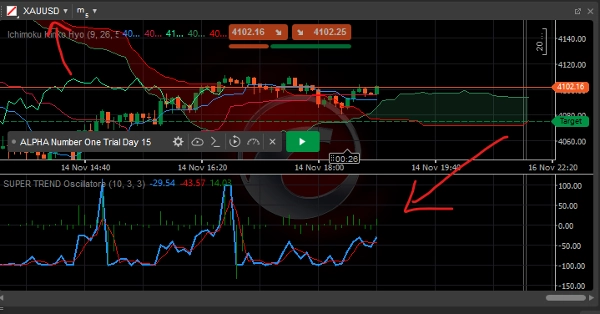
SUPER TREND Oszillator
Vereinfachter SuperTrend Oszillator - Vollständige Beschreibung
Überblick
Der vereinfachte SuperTrend Oszillator ist ein fortschrittlicher technischer Indikator für cTrader, der den klassischen SuperTrend in einen visuellen Oszillator verwandelt, wodurch es einfach wird, Trendrichtung, Stärke und Zuverlässigkeit zu erkennen.
Hauptkomponenten
1. Hauptlinie (Blau)
- Funktion: Zeigt die normalisierte Distanz zwischen Preis und SuperTrend-Linie
- Berechnung:
((Preis - SuperTrend) / (ATR × Multiplikator)) × 100 - Interpretation:
-
- > 0: Bullischer Trend (Preis über SuperTrend)
- < 0: Bärischer Trend (Preis unter SuperTrend)
- Bereich: Von -100 bis +100
2. Signallinie (Rot)
- Funktion: Einfacher gleitender Durchschnitt der Hauptlinie
- Periode: Anpassbar (Standard 3 Perioden)
- Verwendung: Filtert Marktrauschen und bestätigt Signale
3. Histogramm (Grau)
- Funktion: Differenz zwischen Hauptlinie und Signallinie
- Interpretation:
-
- Positiv: Bullische Beschleunigung des Momentums
- Negativ: Bärische Beschleunigung des Momentums
- Null-Durchbruch: Potenzielle Momentum-Umkehrungen
Konfigurierbare Parameter
SuperTrend-Parameter:
- ATR-Periode: Periode für die Berechnung des Average True Range (Standard: 10)
- Multiplikator: Multiplikator für SuperTrend-Bänder (Standard: 3,0)
Oszillator-Parameter:
- Signalperiode: Periode für die Signallinie (Standard: 3)
Signalinterpretation
Trendsituationen:
- Starker bullischer Trend:
-
- Hauptlinie > +50
- Hauptlinie > Signallinie
- Positives Histogramm
- Starker bärischer Trend:
-
- Hauptlinie < -50
- Hauptlinie < Signallinie
- Negatives Histogramm
- Seitwärtsmarkt:
-
- Hauptlinie zwischen -30 und +30
- Häufige Linienkreuzungen
Handelssignale:
Long-Einstieg:
- Hauptlinie kreuzt über 0
- Histogramm wird positiv
- Signallinie bestätigt bullisch
- Hauptlinie über +20 für Momentum
Short-Einstieg:
- Hauptlinie kreuzt unter 0
- Histogramm wird negativ
- Signallinie bestätigt bärisch
- Hauptlinie unter -20 für Momentum
Ausgang/Take Profit:
- Long: Hauptlinie > +80 (überkauft) oder Kreuzung unter Signallinie
- Short: Hauptlinie < -80 (überverkauft) oder Kreuzung über Signallinie
Vorteile der vereinfachten Version
1. Optimierte Leistung
- Effizientere Berechnungen
- Geringerer Ressourcenverbrauch
- Schnellere Reaktion auf Preisänderungen
2. Benutzerfreundlichkeit
- Reduzierte wesentliche Parameter
- Sofortige visuelle Signale
- Einfache Interpretation auch für Anfänger
3. Zuverlässigkeit
- Weniger anfällig für Rauschen
- Sauberere und klarere Signale
- Weniger Fehlsignale im Vergleich zum klassischen SuperTrend
Anwendungsstrategien
Trendfolgestrategie:
- Einstieg: Hauptlinie > 0 für Long, Hauptlinie < 0 für Short
- Filter: Histogramm gleiches Vorzeichen wie Hauptlinie
- Ausgang: Vorzeichenwechsel oder Erreichen extremer Werte
Momentum-Strategie:
- Einstieg: Hauptlinie > +30 (Long) oder Hauptlinie < -30 (Short)
- Bestätigung: Beschleunigendes Histogramm
- Ausgang: Momentum-Verlangsamung (abnehmendes Histogramm)
Mean-Reversion-Strategie:
- Einstieg: Hauptlinie > +80 (Short) oder Hauptlinie < -80 (Long)
- Bestätigung: Histogramm-Umkehr
- Ausgang: Rückkehr zur neutralen Zone
Optimale Marktbedingungen
Trendmärkte:
- Hohe Effizienz
- Langanhaltende Signale
- Weniger Fehlsignale
Seitwärtsmärkte:
- Lotgröße reduzieren
- Zeitrahmen verlängern
- Als Momentum-Filter verwenden
Beste Praktiken
Empfohlene Zeitrahmen:
- Intraday: M15 - H1
- Swing Trading: H4 - D1
- Positionshandel: W1 - MN
Risikomanagement:
- Stop Loss: 1,5-2 × ATR
- Take Profit: 2-3 × Risiko
- Positionsgröße: 1-2% pro Trade
Zusätzliche Bestätigungen:
- Mehrfach-Zeitrahmen-Ausrichtung
- Volumenbestätigung
- Wichtige Unterstützungs-/Widerstandsniveaus
Einschränkungen
Überlegungen:
- Inhärente Verzögerung (Trendfolgeindikator)
- Verminderte Leistung in Seitwärtsmärkten
- Bestätigungen bei niedriger Volatilität erforderlich
Empfehlungen:
- Kombination mit Preisaktionsanalyse
- Als Filter verwenden, nicht als eigenständiges System
- Demo-Test vor Live-Einsatz
Dieser Oszillator stellt ein leistungsstarkes Werkzeug zur Identifizierung starker Trends und zur Filterung von Fehlsignalen dar, während er eine betriebliche Einfachheit beibehält, die sowohl für Anfänger als auch erfahrene Trader geeignet ist.
Zusammenfassung
Kundenbewertungen
5 | 67 % | |
4 | 33 % | |
3 | 0 % | |
2 | 0 % | |
1 | 0 % |


