
설명
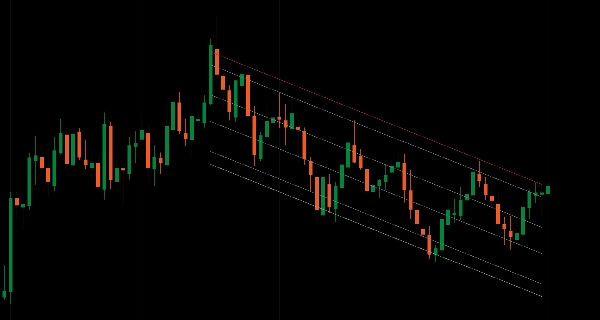
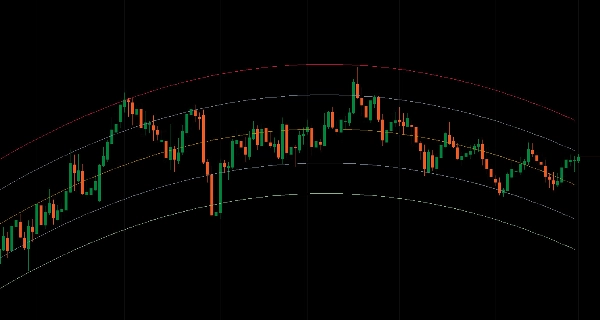
여러 계산 유형, 시간 프레임 및 날짜 범위에 걸친 피보나치 레벨이 포함된 통계적 회귀 채널.
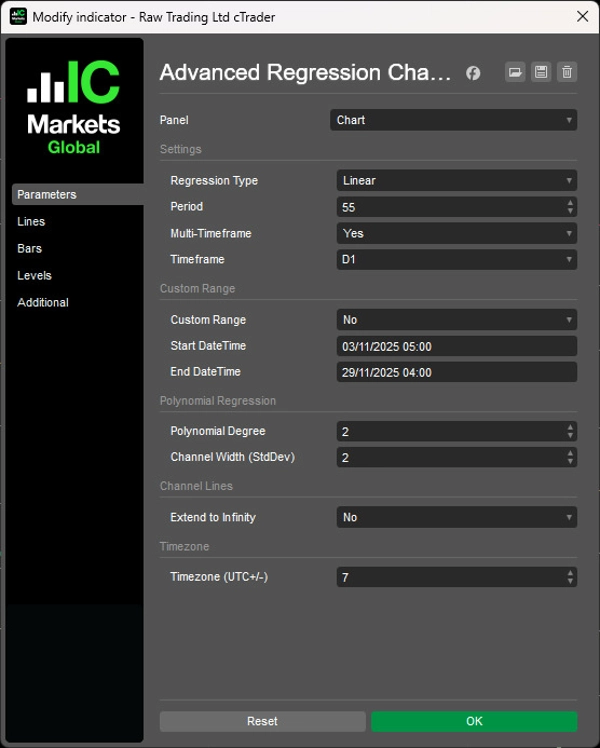
평균 회귀 분석을 위해 표준 편차 밴드와 함께 여덟 가지 방법(선형, 로그, 지수, 가중, 다항식, 이동, 지수 이동, LOWESS)을 사용하여 가격 데이터에 회귀선을 맞춥니다.
아홉 개의 피보나치 채널 레벨(0%에서 100%), 16개 기간에 걸친 다중 시간 프레임 분석과 보간 렌더링, 세 가지 계산 모드(기간 기반, 날짜 범위, MTF), 곡선 추세 구조를 위한 다항식 차수 제어(1-5), 채널 폭 조정을 위한 표준 편차 배수, 이벤트 분석을 위한 시간대 인식 날짜 시간 파싱, 무한대로 확장되는 추세선 투영, 그리고 최적화된 LRU 캐싱을 통해 시장 상황 전반에 걸쳐 평균 회귀 영역과 곡선 가격 구조를 목표로 하는 트레이더에게 포괄적인 통계적 회귀 분석을 제공합니다.
특징
8가지 회귀 계산 유형
- 선형: 고전적인 최소제곱 선형 회귀
- 로그: 지수 가격 움직임을 위한 자연 로그 기반 회귀
- 지수: 가속화 추세를 위한 지수 곡선 적합
- 가중: 최근 바에 더 큰 가중치를 둔 선형 회귀
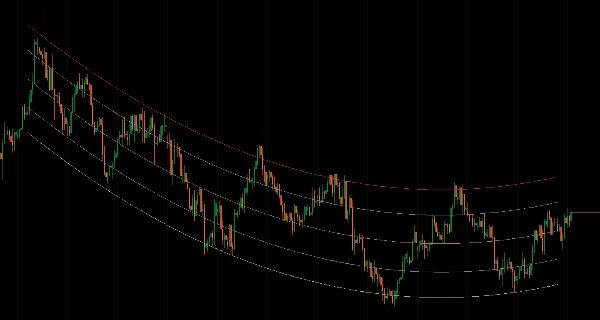
- 다항식: 비선형 추세를 위한 곡선 적합(차수 1-5)
- 이동: 이동 평균 기반 회귀
- 지수 이동: 추세 평활화를 위한 EMA 기반 회귀
- LOWESS: 적응형 평활화를 위한 국소 가중 회귀
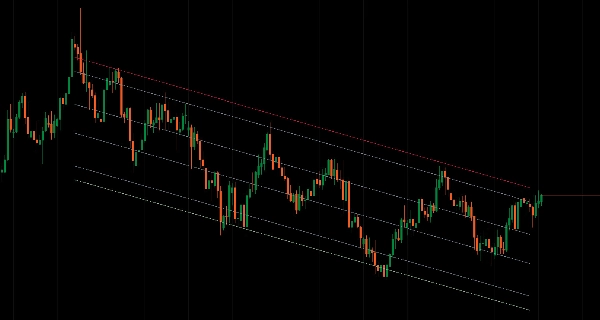
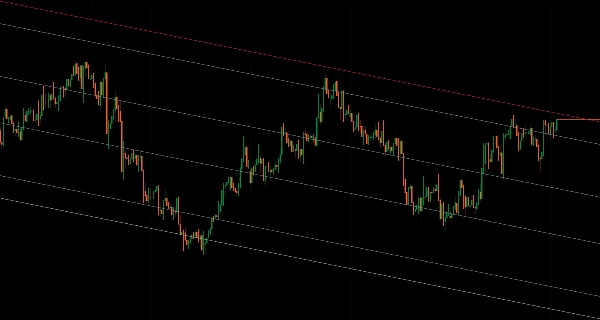
9개의 피보나치 채널 레벨
- 전체 채널 범위: 100%(상단), 88.6%, 76.4%, 61.8%, 50%(중앙선), 38.2%, 23.6%, 11.4%, 0%(하단)
- 회귀 밴드 내 평균 회귀 영역
- 정확한 지지/저항 참조 지점
- 각 레벨별 독립적인 색상/스타일/두께 제어
다중 시간 프레임 분석
- 상위 시간 프레임에서 회귀 계산, 현재 차트에 표시
- 16개의 시간 프레임 사용 가능(m1부터 월간까지)
- 차트 바 전반에 걸친 부드러운 렌더링을 위한 보간된 채널 값
- 차트를 전환하지 않고 상위 시간 프레임 구조 표시
3가지 계산 모드
- 기간 기반: N개의 바를 롤링 윈도우로 사용(기본값)
- 날짜 범위: 특정 이벤트 또는 단계에 대한 사용자 지정 시작/종료 날짜 시간(시간대 인식 날짜 시간 파싱(UTC+/- 오프셋))
채널 표시 옵션
- 표준 출력: 9개 레벨 모두를 지표선으로 표시
- 무한 확장: 앞으로 무한히 투영되는 추세선으로 렌더링
- 색상/스타일 변경 시 자동 새로고침
- 계산 창 너머에 잔여 값 없는 깔끔한 렌더링
날짜 범위 모드
- 정확한 시작/종료 날짜 정의(dd/MM/yyyy HH:mm 형식)
- 특정 시장 이벤트, 단계 또는 구조 분석
- 기간 매개변수와 독립적
- 사용자 로컬 시간에서 서버 시간으로 시간대 변환
동적 계산
- 새로운 바가 형성될 때 실시간 업데이트
- 더티 범위 추적이 포함된 최적화된 LRU 캐싱
- 시간 프레임에 따른 적응형 캐시 크기 조절
- 빠른 날짜 범위 조회를 위한 이진 검색
채널 폭 제어
- 표준 편차 배수(기본값 2.0)
- 변동성 확장을 위한 더 넓은 밴드
- 범위 제한 시장을 위한 더 좁은 밴드
- 모든 회귀 유형에 일관성 유지
다항 회귀
- 차수 제어: 1-5 (높을수록 곡률 증가)
- 비선형 추세 포착
- 포물선형 또는 곡선 가격 구조에 유용
- 차수가 1일 때 선형으로 대체
깔끔한 시각적 관리
- 형성 중인 바에서는 계산하지 않고 완료된 바에서만 계산
- 적절한 다중 시간 프레임 절단—선은 마지막 완료된 HTF 바에서 종료
- 일관된 방향 투영을 위한 기울기 기반 외삽
- 설명적인 레벨 이름이 포함된 명확한 출력 시리즈
__________________________________________________________________________________________
더 많은 무료 지표
구조와 거래량부터 회귀, 변동성, 맞춤 시간 프레임에 이르기까지 다양한 시장 분석 도구를 탐색하세요.
소스 코드는 GitHub 저장소에서 확인할 수 있습니다.
모두 무료로 사용할 수 있습니다. 하지만 커피 지원을 보내고 싶다면 여기로 보내실 수 있습니다.
지지/저항
거래량
이동 평균
유틸리티/커스텀
회귀 기반
변동성
오실레이터
__________________________________________________________________________________________
면책 조항
거래에는 위험이 따릅니다. 이 지표는 기술적 분석용으로만 의도되었으며 항상 적절한 위험 관리와 책임 있는 거래를 적용하십시오.
피드백 및 개선 사항
제안, 기능 요청 또는 개선 아이디어가 있으면 토론 탭에 댓글을 남겨주세요. 여러분의 피드백은 모든 사용자를 위한 지표 개선에 도움이 됩니다.
요약
It offers multi-timeframe analysis across 16 periods (from 1 minute to monthly), enabling regression calculations on higher timeframes displayed on the current chart with smooth interpolated rendering. Users can select among three calculation modes: Period-Based (rolling window), Date Range (custom start/end with timezone-aware parsing), and Multi-Timeframe. Channel width is adjustable via a standard deviation multiplier to reflect market volatility.
The indicator features real-time dynamic updates, optimized caching for performance, and extend-to-infinity trendline projections for forward-looking analysis. Visual output is clean, with slope-based extrapolation and no calculations on forming bars. This tool is designed for traders analyzing mean reversion and complex price structures across various market conditions.


