Descrizione
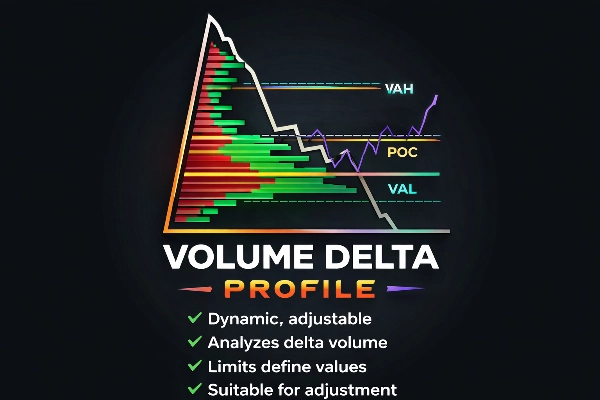
Profilo Delta Volume
Insight Professionale sull'Order Flow per Trader Avanzati
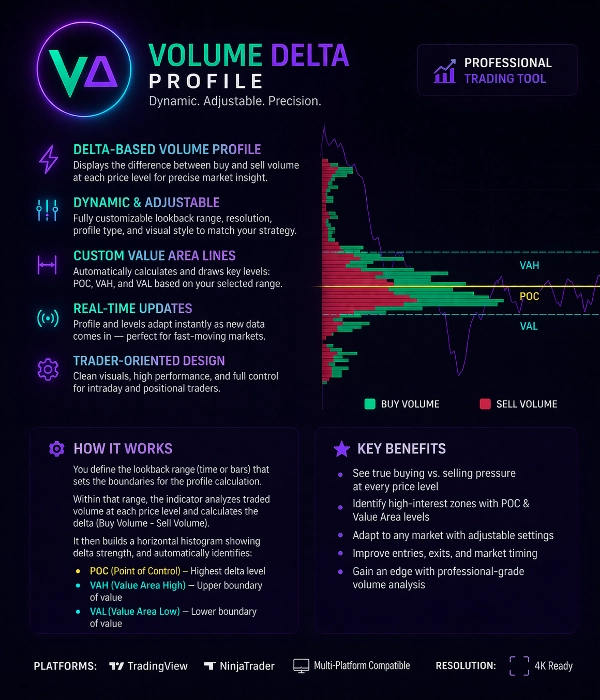
Il Profilo Delta Volume è uno strumento di trading potente progettato per rivelare il vero equilibrio tra acquirenti e venditori a ogni livello di prezzo.
A differenza dei profili di volume tradizionali, questo indicatore analizza Delta Volume (Volume Acquisto – Volume Vendita) per mostrare dove dominano i partecipanti aggressivi al mercato.
Aiuta i trader a identificare l'attività istituzionale, le zone di assorbimento e i livelli di prezzo di alto interesse con precisione.
Caratteristiche Principali
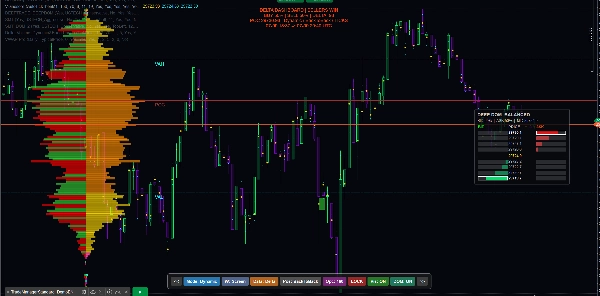
Profilo Volume Basato sul Delta
L'indicatore calcola il delta di volume a ogni livello di prezzo, separando:
• Pressione d'acquisto aggressiva
• Pressione di vendita aggressiva
Questo rivela chi sta effettivamente controllando il mercato.
Intervallo Profilo Dinamico e Regolabile
L'intervallo di calcolo del profilo è completamente personalizzabile.
Gli utenti possono definire l'area di calcolo tramite:
• Intervallo barre personalizzato
• Intervallo sessione
• Selezione manuale
• Intervallo dinamico a rotazione
Il profilo si aggiorna automaticamente con l'arrivo di nuovi dati.
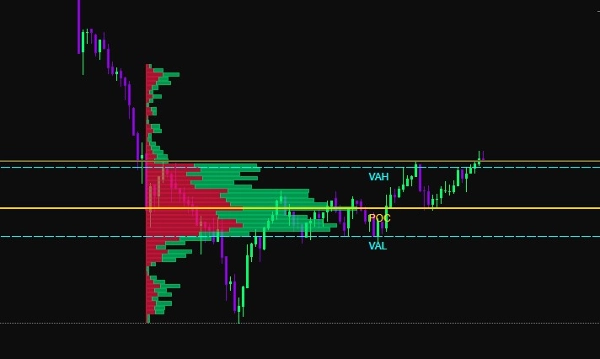
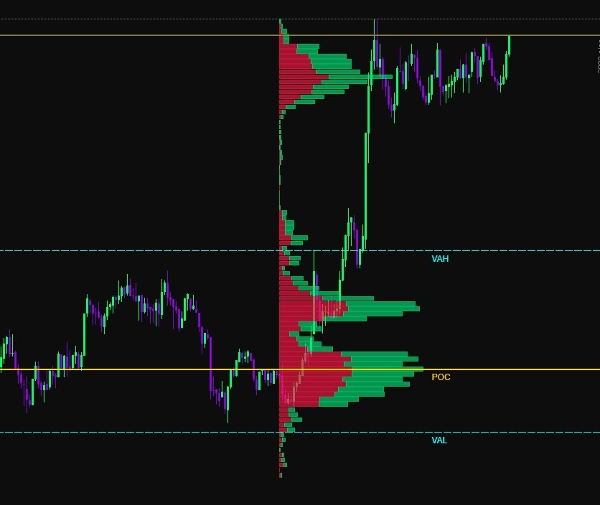
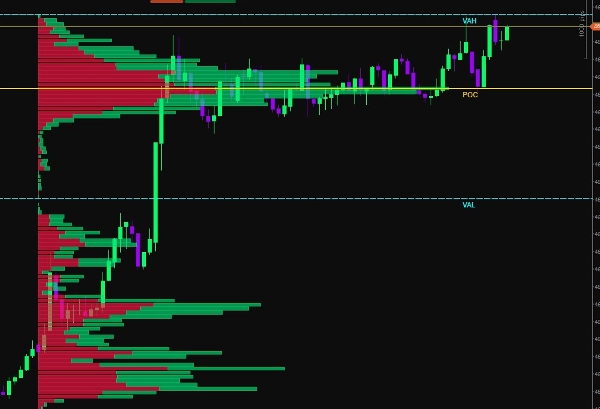
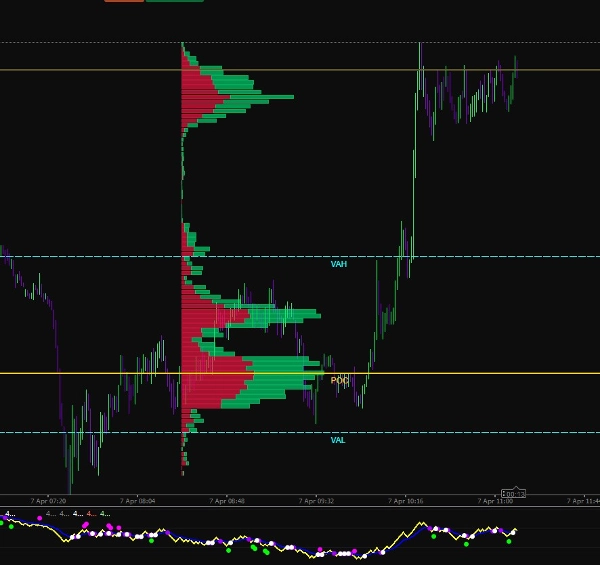
Rilevamento Area di Valore
L'indicatore calcola automaticamente i livelli chiave della struttura di mercato:
POC (Punto di Controllo)
Il livello di prezzo con il delta volume più alto scambiato.
VAH (Valore Area Alto)
Confine superiore dell'area di valore.
VAL (Valore Area Basso)
Confine inferiore dell'area di valore.
Questi livelli evidenziano dove si è verificata la maggior parte dell'attività di mercato.
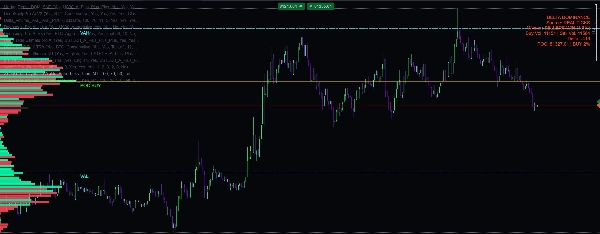
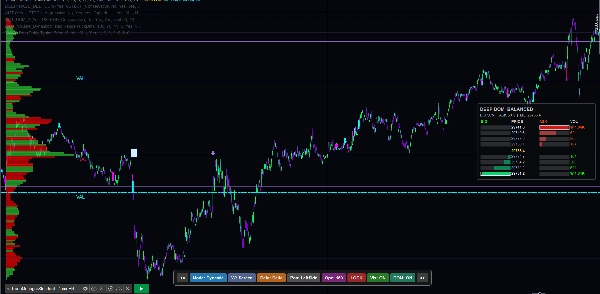
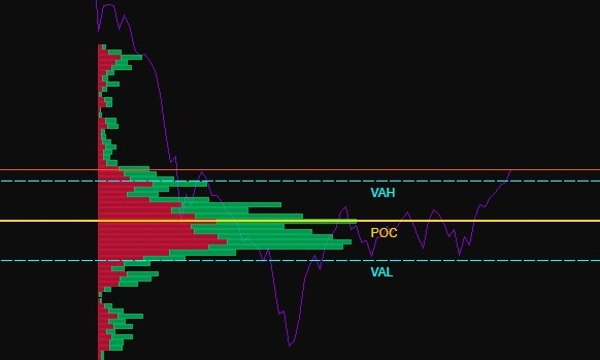
Visualizzazione Acquisto vs Vendita
Il volume è mostrato come un istogramma orizzontale:
Barre verdi → Volume Acquisto dominante
Barre rosse → Volume Vendita dominante
Questo permette ai trader di vedere immediatamente:
• Zone di assorbimento
• Aree di squilibrio
• Cluster di liquidità
• Impronte istituzionali
Visualizzazione Adattiva
L'indicatore include molteplici opzioni di personalizzazione visiva:
• Larghezza istogramma regolabile
• Schemi di colore personalizzati
• Trasparenza regolabile
• Controllo della risoluzione
• Rendering adattivo allo zoom
Questo garantisce una visualizzazione chiara su tutti i timeframe del grafico.
Livelli di Confine Intelligenti
L'indicatore traccia livelli di riferimento dinamici:
• Linea POC
• Linea VAH
• Linea VAL
Questi livelli si aggiornano automaticamente in base al range di profilo selezionato e possono essere usati come:
• Supporto / Resistenza
• Zone di rientro alla media
• Livelli di conferma breakout
Calcolo in Tempo Reale
Il Profilo Delta Volume ricalcola continuamente utilizzando dati di mercato in tempo reale.
Questo garantisce che i trader vedano sempre informazioni aggiornate sull'order flow durante mercati veloci.
Casi d'Uso
Questo strumento è ideale per:
• Scalping
• Trading intraday
• Trading futures
• Analisi dell'order flow
• Monitoraggio della liquidità
• Rilevamento impronte istituzionali
Vantaggi Chiave nel Trading
✔ Identificare la reale pressione di acquisto vs vendita
✔ Rilevare zone di assorbimento ed esaurimento
✔ Individuare livelli di alta liquidità
✔ Migliorare la precisione degli ingressi
✔ Confermare breakout o inversioni
✔ Comprendere la struttura del mercato
Specifiche Tecniche
Metodo di Calcolo:
Delta Volume = Volume Acquisto − Volume Vendita
Tipo di Profilo:
Istogramma Orizzontale dei Livelli di Prezzo
Livelli Automatici:
POC, VAH, VAL
Modalità di Aggiornamento:
Aggiornamento Dinamico in Tempo Reale
Impostazioni Personalizzate:
• Intervallo Profilo
• Risoluzione Istogramma
• Scala del Volume
• Impostazioni Colore
• Visibilità Livelli
Compatibilità Piattaforma:
Ottimizzato per rendering di grafici ad alte prestazioni
Progettato per Trader Professionisti
Il Profilo Delta Volume è costruito per trader che vogliono andare oltre gli indicatori base e comprendere le reali dinamiche del mercato.
Combinando analisi del volume, calcolo del delta e struttura dell'area di valore, questo strumento fornisce una visione chiara della partecipazione al mercato e della distribuzione della liquidità.
Riepilogo
Users can customize the profile calculation range using options such as custom bar range, session range, manual selection, or rolling dynamic range, with real-time updates as new market data arrives. Key market structure levels—Point of Control (POC), Value Area High (VAH), and Value Area Low (VAL)—are automatically calculated and drawn as dynamic reference lines, useful for support/resistance, mean reversion, and breakout confirmation.
Additional features include adjustable histogram width, color schemes, transparency, resolution control, and zoom-adaptive rendering for clear visualization across all chart timeframes. The tool supports use cases like scalping, intraday trading, futures trading, order flow analysis, liquidity tracking, and institutional footprint detection. It is optimized for high-performance chart rendering and aims to provide traders with precise insights into market participation and liquidity distribution.