
QX MatrixHybrid
Indikator
Versi 1.0, Feb 2026
Windows, Mac
4.6
Ulasan: 3
Penerangan
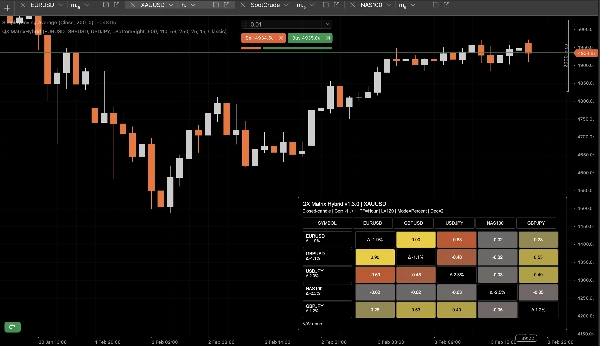
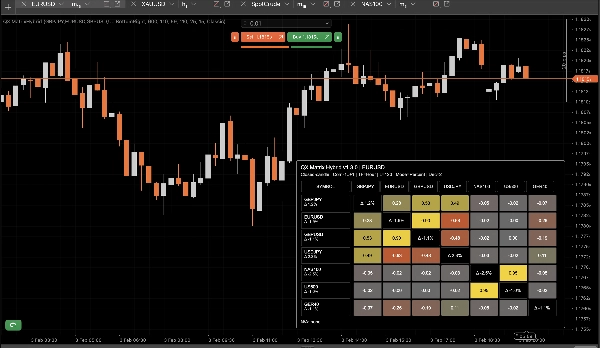
QX Matrix Hybrid adalah penunjuk visual yang memaparkan matriks korelasi pelbagai aset sebagai panel peta haba yang kemas. Ia membantu anda mengenal pasti dengan segera instrumen mana yang bergerak bersama, yang bergerak secara songsang, dan di mana anda mungkin secara tidak sengaja menggandakan pendedahan merentasi pasaran.
Ciri-ciri utama
- Matriks korelasi (-1 hingga +1) menggunakan korelasi Pearson antara simbol.
- Mod Pulangan:
-
- Pulangan peratus
- Pulangan log
- Kekuatan (Δ%) setiap simbol: menunjukkan prestasi setiap simbol sepanjang tetingkap tinjauan semula (dalam label baris dan secara pilihan pada diagonal).
- Kontras teks automatik: warna teks menyesuaikan dengan luminans latar belakang untuk kebolehbacaan.
- Tema + Palet Tersuai: pelbagai pratetap serta kawalan pemilih warna tersuai penuh.
- Susun atur panel yang fleksibel: penempatan sudut, lebar, saiz sel, margin, kawalan ketinggian baris.
- Footer pintar: menyenaraikan simbol yang hilang/tidak tersedia dengan pemotongan yang boleh dikonfigurasikan.
Prestasi & logik kemas kini
Dibina untuk kekal responsif walaupun dengan pelbagai simbol:
- Penyimpanan cache setiap simbol bagi objek Simbol dan Bar untuk mengelakkan panggilan API berulang.
- Penolakan cache automatik apabila CSV Simbol atau Rangka Masa berubah.
- Mod Lilin Tutup Sahaja untuk meminimumkan beban CPU (kemas kini pada bar tertutup baru).
- Pilihan Throttle Kemas Kini (ms) untuk mod langsung.
Cara menggunakannya
- +1.00: pergerakan bersama positif yang kuat (redundansi tinggi).
- 0.00: hubungan rendah (potensi diversifikasi).
- -1.00: hubungan songsang yang kuat (kemungkinan lindung nilai).
Gunakan matriks untuk mengurangkan pertindihan berkorelasi, mencari pasangan lindung nilai, dan memahami “kelompok” pasaran merentasi FX, indeks, logam, kripto, dan lain-lain.
Parameter (peringkat tinggi)
- CSV Simbol, Rangka Masa, Tinjauan Semula
- Mod Pulangan (Peratus/Log), Perpuluhan, Perpuluhan automatik pada Log
- Lilin Tutup Sahaja, Throttle Kemas Kini
- Tunjukkan Kekuatan (Δ%), Tunjukkan Footer, Footer Maksimum Hilang
- Susun atur panel (sudut, lebar, saiz sel, margin)
- Warna / Tema (termasuk palet tersuai)
Nota
- Hanya visualisasi. Tiada pesanan dibuat.
- Simbol mungkin menunjukkan N/A jika tidak tersedia pada broker/pelayan anda atau jika tidak cukup sejarah untuk rangka masa/tinjauan semula yang dipilih.
Ringkasan
Ringkasan AI
QX MatrixHybrid is a real-time visual indicator that presents a multi-asset correlation matrix as a heatmap panel. It displays Pearson correlation coefficients ranging from -1 to +1 between up to 12 selected symbols, helping users identify strong positive correlations, inverse relationships, and low correlations for diversification or hedging purposes. The indicator supports multiple return modes, including percent and log returns, and tracks each symbol’s performance over a configurable lookback period, showing strength as percentage change.
The interface offers full customization with multiple color themes and a custom palette, adjustable panel layout options (such as docking, cell size, and margins), and automatic text contrast for readability. It includes a smart footer that lists missing or unavailable symbols with configurable truncation.
Performance optimizations include per-symbol caching to reduce API calls, automatic cache invalidation on symbol or timeframe changes, and a "Closed Candle Only" mode to minimize CPU load by updating only on new closed bars. An optional update throttle controls live update frequency.
QX MatrixHybrid is designed for use across various markets including forex, indices, commodities, metals, and cryptocurrencies. It is a visualization tool only and does not place orders. Symbols may show as unavailable if data is insufficient or missing.
Profil indikator
Ulasan pelanggan
4.6
Ulasan: 3
5 | 67 % | |
4 | 33 % | |
3 | 0 % | |
2 | 0 % | |
1 | 0 % |
Ulasan pelanggan
February 12, 2026
The part that matters is bad ideas get easier to avoid, and 20 signals is a fair first sample.
February 9, 2026
Two sessions say more than one clean chart, and weak ideas are easier to skip.
February 5, 2026
Ngl, weak ideas are easier to skip and that is enough to keep testing it. Price action still has to agree.
Perbincangan
Soalan Lazim
Signal
Indices
Commodities
GBPUSD
RSI
Bollinger
Fibonacci
Scalping
AI
XAUUSD
NAS100
MACD
BTCUSD
Forex
Breakout
EURUSD
NZDUSD
Martingale
Prop
ZigZag
Supertrend
Fair Value Gap
SMC
Crypto
Grid
Stocks
ATR
USDJPY
VWAP
Produk yang tersedia melalui cTrader Store, termasuk bot dagangan, indikator dan plugin, disediakan oleh pembangun pihak ketiga dan diberikan akses untuk tujuan maklumat dan teknikal sahaja. cTrader Store bukan broker dan tidak memberikan nasihat pelaburan, syor peribadi atau sebarang jaminan prestasi masa hadapan.


![Logo "[Stellar Strategies] Inside Bar with Signals"](https://cdn.ctrader.com/image/webp/1d9e8bfa-3b2c-4440-bb37-5856902008a7_30683)


Harga
41.97M
Volum yang didagangkan
208.53K
Pip dimenangi
13
Jualan
354
Pemasangan percuma