
설명
🚀 10,000명 이상의 트레이더가 이미 우리의 TOP 지표🏆
👉 모든 TOP 시스템을 여기에서 받으세요:
_______________________________________________
📌 시장 구조 지표
· ✅ AdvancedMarket Structure: Bos, Choch, SwinLevels, Order Blocks, 시장 구조& 유동성 탐지기
· 🔄 동적 시장 구조 전환점 분석
· 🧱 오더 블록
· ⚖️ 시장 불균형
· ⛓️ BOS & CHOCH
· 🧠 ICT 파워 오브 3
· 🌀 시장 극성 구역
_______________________________________________
🔚 스마트 종료 시스템
· 📍 추적 스마트 알고리즘
_______________________________________________
📐 지그재그 지표
· 🔍 지그재그 가격 유동성 투영
· 🧭 S&R 구조적 지그재그
· ➖ 지그재그
· 🎯 지그재그 극한 추적기
_______________________________________________
🧱 지지 및 저항 지표
· 🟩 스마트트렌드 지지 및 저항선
· 🧱 모든 지지 및 저항 레벨
_______________________________________________
📊 추세 및 채널 지표
· 🔄 자동 추세 채널
· 📊 슈퍼트렌드
· ⚡모멘텀 추세 분석기
· 🧠 적응형 추세 채널
· 💥 채널 돌파 시스템
· 🌈 동적 추세 그라디언트
· ⭐ 프리미엄 SSL 채널
· 🔁 반응형 이동평균
_______________________________________________
💧 거래량 및 유동성 도구
· 🔥 거래량 POC 히트맵
· 📉 레버리지 청산 지도
· 🔍 모멘텀 공정 가치 갭
· 🕒 공정 가치 갭 세션
_______________________________________________
⚡ 모멘텀 및 RSI 지표
· 📈 RSI 추세 트리거
· 🚀 동적 범위 모멘텀
_______________________________________________
🔮 예측 및 투영 도구
· 📈 거래량 기반 시장 흐름 투영기
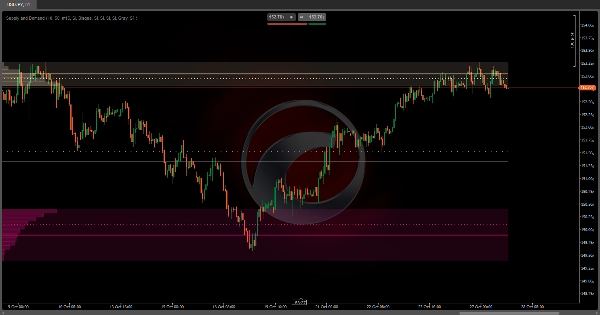
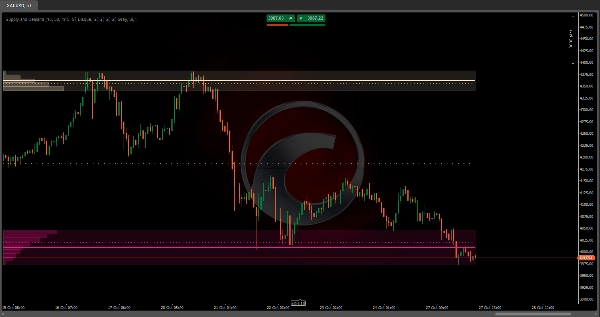
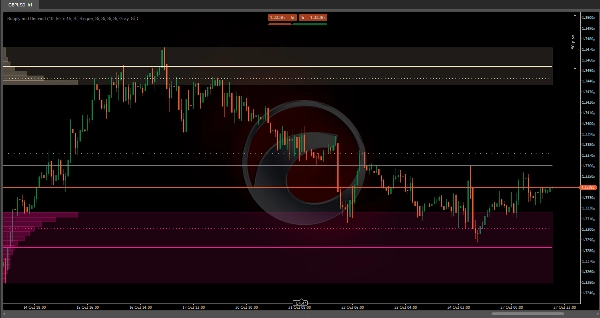
자동 공급 및 수요: 💹
자동 공급 및 수요는 차트에서 가장 높은 거래 활동 구역을 자동으로 식별하는 고급 거래량 분석 지표입니다. 📊 다른 정적 지표와 달리, 이 지표는 관찰 중인 시각적 범위에 동적으로 조정되며, 차트를 확대하거나 스크롤할 때마다 구역을 재계산합니다.
어떻게 작동하나요? ❓
알고리즘은 보이는 가격 범위를 여러 개의 수평 레벨(2에서 500까지 설정 가능)로 나누고 각 레벨에서 거래된 거래량을 분석합니다. 더 높은 정밀도를 위해 관찰 중인 타임프레임보다 낮은 타임프레임의 데이터를 사용합니다. 🕒 예를 들어, 1시간 차트를 보고 있다면 15분 캔들을 분석하여 거래량이 실제로 집중된 위치를 더 자세히 감지할 수 있습니다.
식별 과정 🔍
지표는 극단에서 중심으로 작동합니다:
- 가장 높은 가격부터: 🚀 보이는 범위의 최고점에서 시작하여 레벨별로 하락하며 각 가격 구간에서 거래된 거래량을 누적합니다.
- 가장 낮은 가격부터: 📉 동시에 최저점에서 상승하며 거래량을 누적합니다.
- 활성화 임계값: ⚡ 이 구역들 중 어느 하나가 전체 거래량의 특정 비율(기본값 10%, 설정 가능)을 누적하면 중요한 구역으로 표시되고 해당 방향으로의 탐색이 중단됩니다.
- 중간 구역: ⚖️ 상단과 하단 구역이 모두 식별되면 중간 공간은 중립 또는 균형 구역으로 표시됩니다.
무엇을 위한 것인가요? 🎯
이 지표는 시장 구조 분석 도구로서 다음을 도와줍니다:
- 식별 공급 구역: 🏔️ 역사적으로 높은 매도 활동이 있었던 상단 영역.
- 식별 수요 구역: 🏖️ 매수 활동이 집중된 하단 영역.
- 감지 균형 구역: 🎭 매수와 매도 압력이 균형을 이루는 중간 범위.
이 구역들은 많은 참여자들이 포지션을 취한 레벨이기 때문에 미래에 가격의 자석 역할을 하는 경향이 있습니다. 🧲
어떻게 결합할 수 있나요? 🔗
가격 행동 전략과 함께:
- 식별된 구역의 재테스트 를 기다려 반전 확인을 찾습니다.
- 구역을 이익 실현 목표 또는 손절매 위치로 사용합니다.
추세 지표와 함께:
- 상승 추세에서는 수요 구역의 하단을 가격이 재테스트할 때 진입을 찾습니다. 📈
- 하락 추세에서는 공급 구역의 상단을 저항으로 사용하여 매도를 합니다. 📉
다중 타임프레임 분석과 함께:
- 상위 타임프레임에서 구역을 식별하고 하위 타임프레임에서 확인을 찾습니다.
- 상위 타임프레임의 구역은 하위 타임프레임에서 여러 구역을 포함할 수 있습니다.
모멘텀 지표와 함께:
- RSI 또는 스토캐스틱과 결합하여 구역 내 과매수/과매도 상태를 확인합니다.
- 발산은 공급/수요 구역에서 잠재적 반전을 신호할 수 있습니다.
사용자 정의 구성 ⚙️
이 지표는 각 구역을 독립적으로 완전히 조정할 수 있습니다:
- 각 시각적 요소(영역, 평균선, 가중선)를 활성화/비활성화합니다.
- 거래량 임계값: 구역을 중요하게 간주하기 위해 누적되어야 하는 전체 거래량의 비율입니다.
- 가격 분할: 숫자가 클수록 정밀도가 높아지지만 계산량도 많아집니다.
- 하위 타임프레임: 거래량 분석의 세분성을 정의합니다.
주요 기능: 자동 적응 🔄
보기 기준 자동 재계산. 즉:
- 만약 당신이 확대하여 세션의 세부 사항을 보면, 해당 시간대의 특정 공급 및 수요 구역을 식별합니다.
- 만약 당신이 축소하여 몇 주 또는 몇 달을 보면, 전체 기간에 대한 매크로 구역을 재계산합니다.
- 차트를 스크롤할 때마다 구역이 보이는 범위의 컨텍스트를 반영하도록 업데이트됩니다.
요약
The indicator divides the visible price range into configurable horizontal levels (2 to 500 divisions) and analyzes volume traded at each level using data from a lower timeframe than the chart’s timeframe for enhanced accuracy. It identifies significant zones by accumulating volume from the highest and lowest visible prices until a configurable volume threshold (default 10%) is reached, marking these as supply and demand zones respectively. The area between these zones is designated as a balance zone, representing equilibrium between buying and selling pressures.
These zones highlight areas of historically high trading activity that often act as future price magnets. The indicator supports customization of visual elements, volume thresholds, price divisions, and analysis timeframe. It can be combined with price action strategies, trend indicators, multiple timeframe analysis, and momentum indicators like RSI or Stochastic to improve trade entries, exits, and confirmations.
Supported markets include Forex, Indices, Commodities, Stocks, and Cryptocurrencies, with symbols such as EURUSD, GBPUSD, BTCUSD, XAUUSD, and NAS100.
고객 리뷰
5 | 50 % | |
4 | 0 % | |
3 | 0 % | |
2 | 0 % | |
1 | 50 % |


!["Smart Money Concepts (SMC) [Iridio Capital]" 로고](https://cdn.ctrader.com/image/webp/28b69fd1-ef54-4bed-9487-07e78e883be4_40934)


