
Mô tả
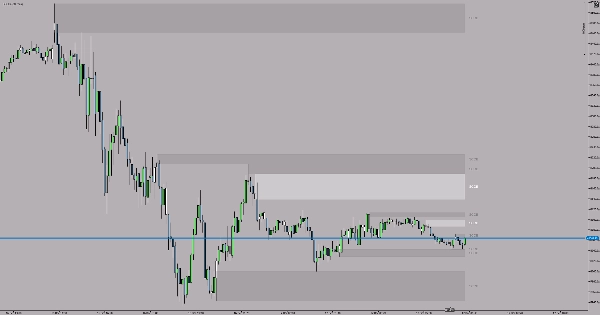
Chỉ báo SCOB (Single Candle Order Block) tự động xác định và làm nổi bật các mẫu khối lệnh mạnh trên biểu đồ của bạn. Công cụ đơn giản nhưng hiệu quả này giúp các nhà giao dịch phát hiện các mẫu đảo chiều quan trọng thường chỉ ra hoạt động tổ chức mạnh mẽ.
SCOB là gì?
SCOB là một mẫu gồm ba cây nến tiết lộ các vùng đảo chiều tiềm năng:
SCOB tăng giá:
- Cây nến thứ 2 tạo đáy thấp hơn cây nến thứ 3
- Đáy của cây nến thứ 1 nằm trên đáy của cây nến thứ 2
- Cây nến thứ 1 đóng cửa trên đỉnh của cây nến thứ 2
- Cây nến thứ 2 được làm nổi bật như một vùng hỗ trợ tiềm năng
SCOB giảm giá:
- Cây nến thứ 2 tạo đỉnh cao hơn cây nến thứ 3
- Đỉnh của cây nến thứ 1 nằm dưới đỉnh của cây nến thứ 2
- Cây nến thứ 1 đóng cửa dưới đáy của cây nến thứ 2
- Cây nến thứ 2 được làm nổi bật như một vùng kháng cự tiềm năng
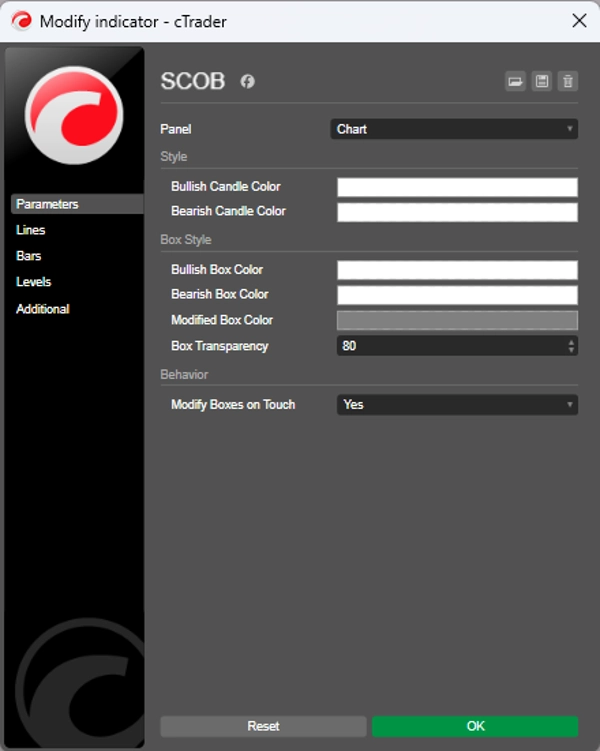
Cài đặt
Màu nến tăng giá - Chọn màu làm nổi bật cho các mẫu SCOB tăng giá (Mặc định: Trắng)
Màu nến giảm giá - Chọn màu làm nổi bật cho các mẫu SCOB giảm giá (Mặc định: Vàng)
Mẹo sử dụng
- Sử dụng các mẫu SCOB để xác định các vùng vào lệnh tiềm năng
- Kết hợp với các công cụ phân tích kỹ thuật khác để xác nhận
- Cây nến được làm nổi bật đại diện cho một mức tổ chức quan trọng
- Luôn giao dịch theo xu hướng để có các thiết lập xác suất cao hơn
- Có thể sử dụng trên bất kỳ khung thời gian nào dựa trên chiến lược giao dịch của bạn
- Thực hành tốt nhất: Đánh dấu các mẫu SCOB trên các khung thời gian cao hơn (H1, H4, Daily) và giao dịch theo hướng của xu hướng.
Tóm tắt
Hồ sơ chỉ báo
Đánh giá của khách hàng
4.5
Đánh giá: 2
5 | 50 % | |
4 | 50 % | |
3 | 0 % | |
2 | 0 % | |
1 | 0 % |
Đánh giá của khách hàng
October 3, 2025
Helps more when the trader avoids forced trades. It should not replace the chart.
Thảo luận
Câu hỏi thường gặp
BTCUSD
Forex
Indices
EURUSD
Commodities
GBPUSD
Prop
Scalping
SMC
Crypto
Stocks
XAUUSD
NAS100
USDJPY
Các sản phẩm có sẵn trên cTrader Store, bao gồm bot giao dịch, chỉ báo và plugin, được cung cấp bởi các nhà phát triển bên thứ ba và chỉ nhằm mục đích cung cấp thông tin và tiếp cận kỹ thuật. cTrader Store không phải là nhà môi giới và không cung cấp lời khuyên đầu tư, khuyến nghị cá nhân hay bất kỳ đảm bảo nào về hiệu suất trong tương lai.


![Logo "Gaussian Channel [Iridio Capital]"](https://cdn.ctrader.com/image/webp/7c039209-5573-4a54-a072-f9528b503103_41960)


Giá
Kể từ 05/01/2025
14
Lượt bán