
VolumeRenkoRange
지표
1.41K 다운로드
버전 1.1, Jan 2026
Windows, Mac
5.0
리뷰: 1
설명
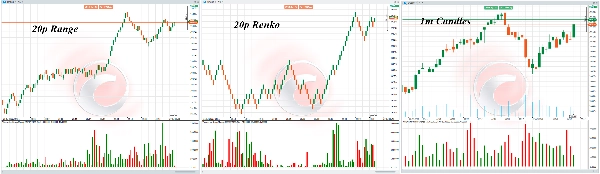
VolumeRenkoRange 가격 기반 차트에 틱 볼륨 로직을 적용합니다.
캔들처럼 볼륨 계산을 위해 틱 데이터를 사용합니다.
바의 시작/종료 시간을 알기 때문에 가능합니다:
볼륨 로직 = 바 형성 중 가격 업데이트(틱)의 수 (OpenTime과 CloseTime 사이).
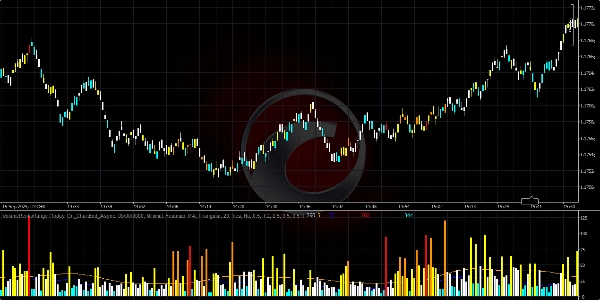
rev.1의 새로운 점은?
모든 "Order Flow Aggregated" 관련 개선사항 포함
- 고성능 VolumeTick()
- 비동기 틱 데이터 수집
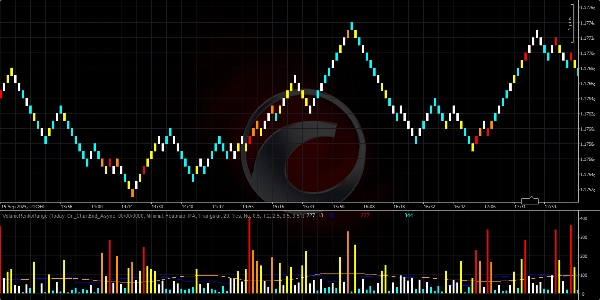
- 히트맵/페이딩 색상
요약
AI 요약
VolumeRenkoRange is an indicator designed for price-based charts such as Renko and Range charts. It applies tick volume logic by calculating the number of price updates (ticks) that occur during the formation of each bar, using the bar's open and close times. This approach enables volume measurement on non-time-based charts similarly to traditional candlestick charts. The indicator incorporates high-performance tick volume calculation, asynchronous tick data collection, and visual enhancements like heatmap and fading coloring to represent volume intensity. It is part of a suite of cTrader Store indicators focused on order flow and volume analysis.
지표 프로필
고객 리뷰
5.0
리뷰: 1
5 | 100 % | |
4 | 0 % | |
3 | 0 % | |
2 | 0 % | |
1 | 0 % |
고객 리뷰
July 9, 2025
Pros: Displays volume-based Renko blocks, filtering noise and highlighting impulsive moves. Flexible settings, stable performance. Cons: No tooltips or alerts. No template saving. Requires additional confirmation tools for reliable trading decisions.
상담
자주 묻는 질문(FAQ)
VWAP
트레이딩 봇, 지표, 플러그인 등 cTrader Store에서 제공되는 상품은 제3자 개발자에 의해 제공되며, 이는 단순히 정보 및 기술적 접근을 목적으로 제공된 것입니다. cTrader Store는 중개인이 아니며, 투자 조언, 개인별 추천 또는 향후 성과에 대한 어떠한 보장도 제공하지 않습니다.


가격
가입일 12/12/2024
1
판매
33.28K
무료 설치