Açıklama
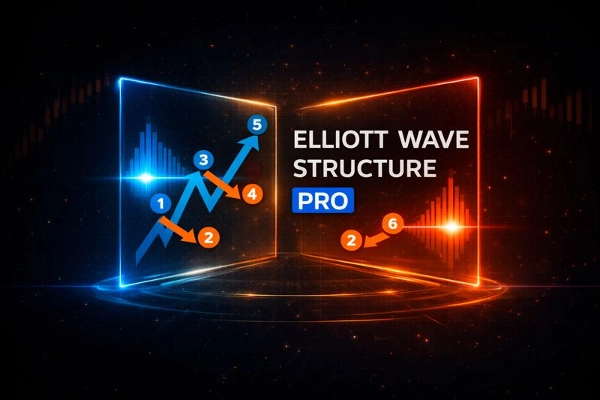
Elliott Dalga-3 Devam & Elliott Dönüşleri
Elliott Dalga Yapısı Elliott Dalga teorisi ile piyasa yapısını analiz etmek için tasarlanmış bir göstergedir.
Birleştirir onaylanmış salınım analizini, piyasa yapısını, Elliott itme tespitini ve özel bir Dalga-2'den Dalga-3'e devam.
Bu araç, öznel çizim değil, netlik, onay ve kural tabanlı uygulama gerektiren traderlar için oluşturulmuştur.
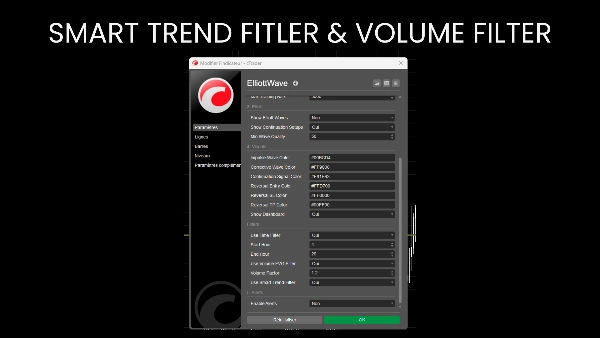
Yeniden Boyanmayan Salınım Motoru
Tüm hesaplamalar onaylanmış salınım noktalarına dayanır:
- Ayarlanabilir salınım derinliği
- Minimum fiyat sapması (pip filtresi)
- Onay barları
Bir salınım yazdırıldıktan sonra asla hareket etmez, tam tarihsel güvenilirlik sağlar.
Piyasa Yapısı Analizi:
Otomatik olarak tanımlar ve etiketler:
- Yüksek Yüksek (YY)
- Yüksek Düşük (YD)
- Düşük Yüksek (DY)
- Düşük Düşük (DD)
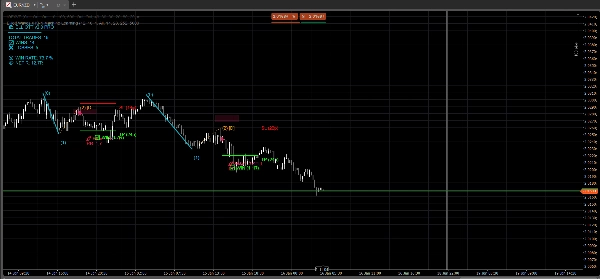
Elliott Dalga İtme Tespiti:
Gösterge otomatik olarak her iki yönde tam 5 dalgalı Elliott itmelerini tespit eder:
- Boğa: D-Y-D-Y-D-Y
- Ayı: Y-D-Y-D-Y-D
İtme hareketlerini dahili kurallarla doğrular:
- Dalga 3 gücü
- Dalga 2 ve Dalga 4 geri çekilme mantığı
- Dalga 5 orantısı
Her itme, kalite puanı (0–100) ile derecelendirilir ve doğrudan grafik üzerinde etiketlenir.
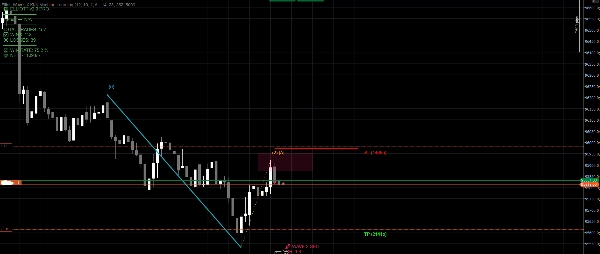
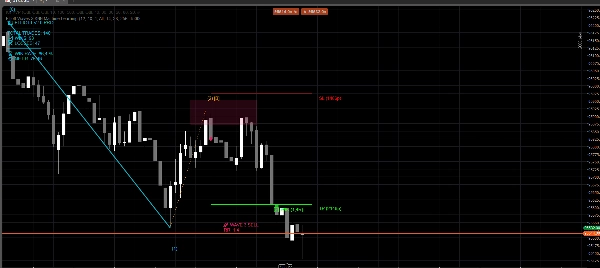
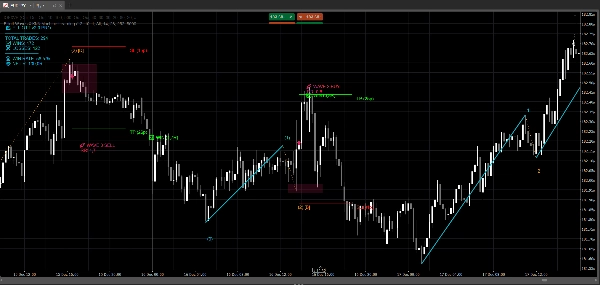
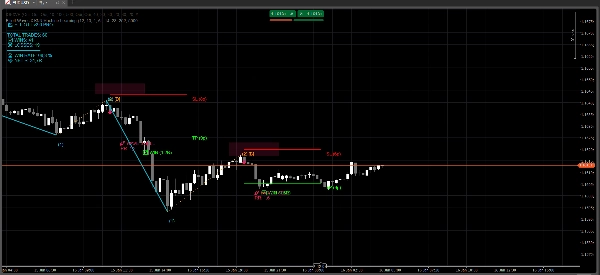
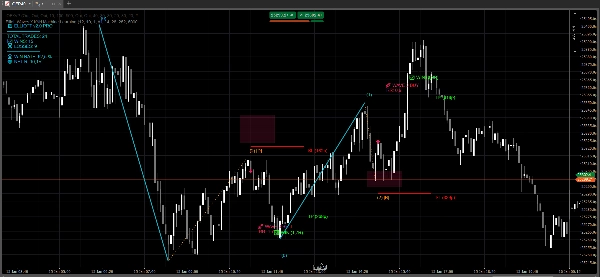
Dalga-3 Devam Kurulumu (Birincil Ticaret Modülü)
Bu, göstergenin temel ticaret bileşenidir.
Sistem, Dalga 0-1-2 devam yapılarını tanımlar ve Dalga 3 için girişleri hazırlar:
- Boğa: Düşük → Yüksek → Daha Yüksek Düşük
- Ayı: Yüksek → Düşük → Daha Düşük Yüksek
Doğrulama kriterleri şunları içerir:
- Dalga 2 geri çekilmesi %23,6 ile %88,6 arasında
- Dalga 0 tarafından geçersiz kılınmama
- Piyasa yapısı kullanılarak trend uyumu
- ATR'ye göre Dalga 1 gücü
- Fiyatın OB üzerinde olması gerekir
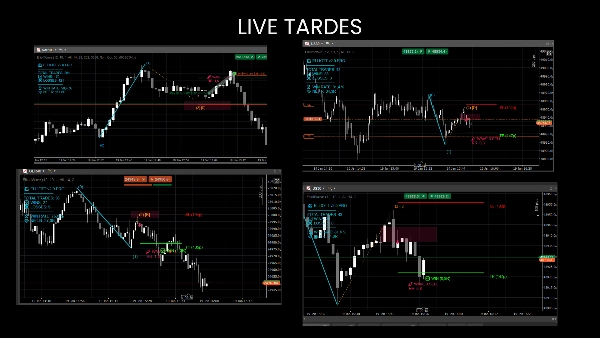
Doğrulandığında, gösterge otomatik olarak çizer:
- Dalga 1 ve Dalga 2 yapısı
- OB giriş bölgesi
- Giriş sinyali
- Dalga 2 ötesinde ATR'ye dayalı Stop Loss
- ATR projeksiyonuna dayalı Kar Al
Risk & İşlem Yönetimi
- Stop Loss ve Kar Al, ATR kullanılarak dinamik olarak hesaplanır
- Risk-Ödül oranı doğrudan grafik üzerinde gösterilir
- Aşırı genişlemiş veya düşük kaliteli kurulumları önlemek için tasarlanmıştır
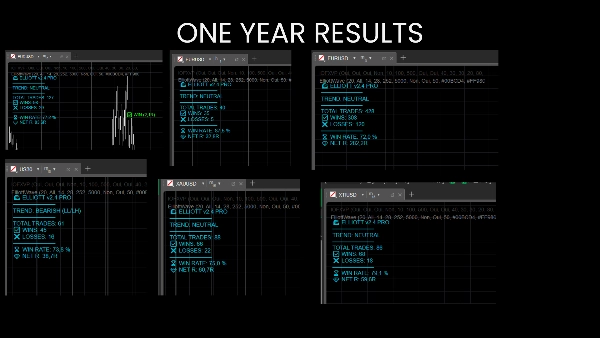
Kişisel olarak M1 ve M5'te endekslerde scalping için kullanıyorum, ancak FX, emtialar, hisse senetleri vb. ile de çalışır... Gösterge paneli, belirli bir varlıkta karlı olup olmadığını gösterir.
Ücretsiz sürüm, büyük FX M15 üzerinde denemenize izin verir.