
Order Flow Ticks v2.0
지표
12.07K 다운로드
버전 1.1, Jan 2026
Windows, Mac
4.4
리뷰: 23
설명
마지막 설명 -> 11/11/2025
Order Flow Ticks (집계 버전)의 모든 측면은 성능을 염두에 두고 신중하게 설계되어 저사양 기기에서도 실행할 수 있습니다.
그래도 더 나은 사용을 위한 몇 가지 "팁과 요령"이 있습니다:
- 틱 데이터는 cTrader가 이미 좋은 메모리 관리를 제공함에도 불구하고 RAM에 저장됩니다:
-
- 실시간 거래에 정말 필요한 것만 로드하세요.
- 파라미터 패널은 이미 각 모드에서 지원되는 파라미터를 보여줍니다.
- 세그먼트 간격은 필터 분석을 변경할 수 있으므로, 일중 모멘텀에는 일간 간격을 사용하세요.
- 더 높은 타임프레임에서(가격 기반 차트 포함)
-
- ODF + VP를 주간으로 설정하세요.
- 일수 / 일간 리셋? 파라미터는 이제 주/주간입니다.
- 모든 필터는 매일이 아닌 매주 리셋됩니다.
- "더 낮은 타임프레임"과 "작은 행 크기":
-
- 사용자 정의 이동평균은 파라미터 패널에서 설정 전환 시 재계산 속도를 높이기 위해 만들어졌습니다.
- cTrader 이동평균을 계속 사용하려면 [ODF] 사용자 정의 이동평균 사용?을 거짓으로 설정하세요.
-
- 필터 [결과 / 스파이크 / 버블]가 활성화되면 인내심을 가지세요.
- 고성능이 필요한 경우:
-
- 볼륨 프로파일을 비활성화하거나 대신 미니 VP를 사용하세요. (기본값)
- "특정 설정"의 "[VP] 업데이트 전략"에서 "동시"를 사용하세요. 다만 RAM 사용량이 증가합니다. (기본값)
- "성능 그리기" 설정에서 "Redraw_Fastest"를 사용하세요. (기본값)
- 사용자 정의 이동평균을 사용하세요. (기본값)
- 많은 수의 채워진 도형 및/또는 텍스트 도형은 매우 무거울 수 있습니다.
- 백테스팅 시 가격 기반 차트의 일부 도형이 깨질 수 있지만 실시간에서는 정상 작동합니다.
- 저장된 설정은 "Documents/cAlgo/LocalStorage/ODFT-AGG ..."에 저장됩니다.
Order Flow Ticks의 새로운 분석 기능:
- 틱 스파이크 필터
-
- 이동평균 또는 표준편차.
- 아이콘 또는 버블로 표시.
- 스파이크 레벨.
- 스파이크 차트 (버블):
-
- 히트맵 색상.
- 양/음 색상.
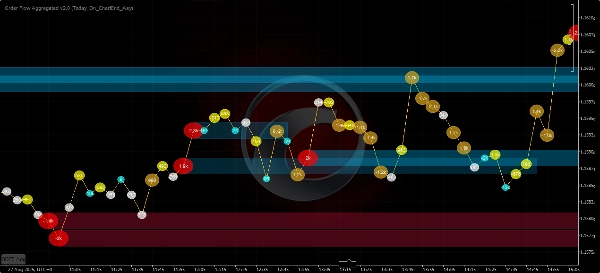
- 버블 차트
-
- 이동평균, 표준편차 또는 둘 다.
- [볼륨 델타 / 누적 델타 변화 / 델타 빼기]를 소스로 사용.
- 울트라 버블 레벨.
- 히트맵 색상.
- 모멘텀 색상:
-
- 페이딩
- 양/음
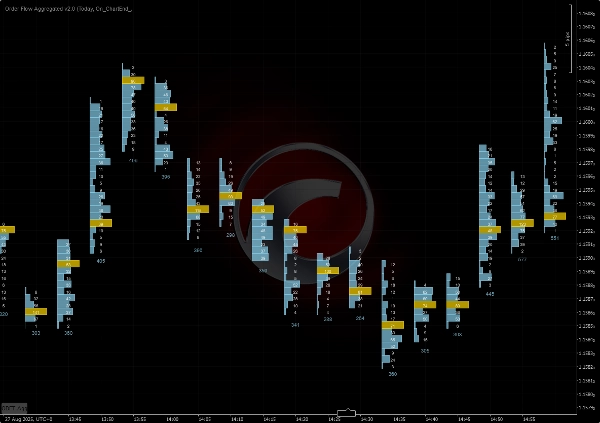
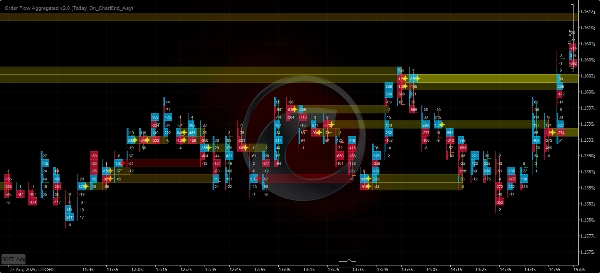
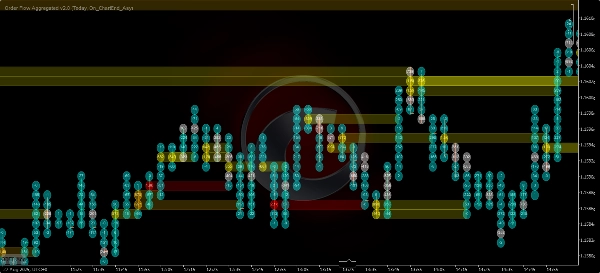
- 볼륨 프로파일
-
- 미니 VP - 5분부터 1일까지.
- 일간, 주간, 월간 프로파일!
- 고정 범위 프로파일.
=============================
항상 cTrader 스토어 버전을 우선 사용하세요. 그것이 가장 먼저 업데이트됩니다.
제가 개발한 모든 지표는 오픈 소스입니다. 코드에 접근할 수 없다면, Github 저장소를 확인하세요.
요약
AI 요약
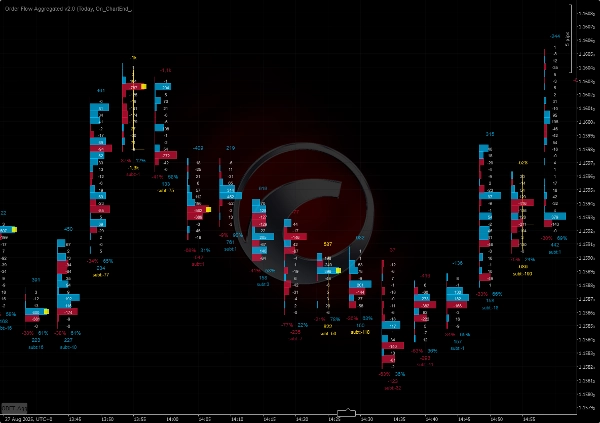
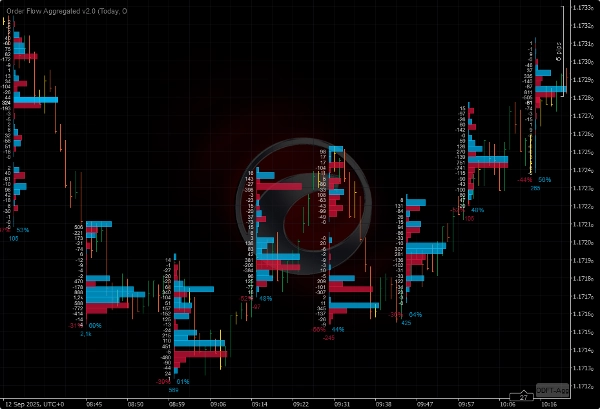
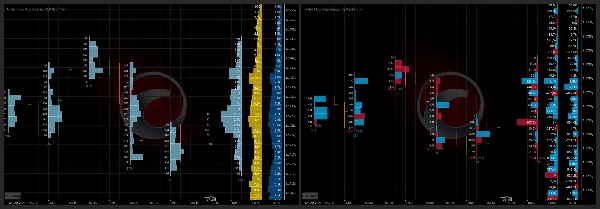
Order Flow Ticks v2.0 is an open-source indicator for the cTrader platform that adapts traditional Order Flow (Footprint) concepts to tick volume data. It supports multiple chart types including ticks, Renko, and range charts. The indicator offers several visualization modes: Normal Mode (volume profile per bar), Buy vs Sell Divided Mode (bid/ask footprint), Buy vs Sell Profile Mode, Delta Divided Mode (delta footprint), and Delta Profile Mode.
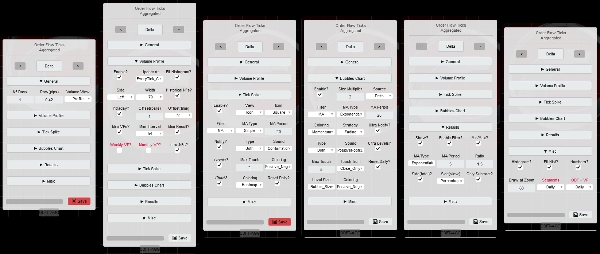
Version 2.0 introduces a parameters panel for quick switching between settings such as volume modes and row height, and it uses the Colors API exclusively. It is compatible with Mac OS and requires .NET 6.0 or higher.
Key features include:
- Tick Spike Filter with moving average or standard deviation, displayed as icons or bubbles with heatmap and positive/negative coloring.
- Bubbles Chart showing volume delta, cumulative delta change, or subtract delta with momentum coloring and ultra bubble levels.
- Volume Profile options including mini-profiles from 5 minutes to 1 day, daily, weekly, monthly, and fixed range profiles.
The indicator is optimized for performance to run efficiently on lower-end machines. It stores tick data in RAM and offers settings to balance performance and detail, including custom moving averages and concurrent update strategies. Saved settings are stored locally.
지표 프로필
고객 리뷰
4.4
리뷰: 23
5 | 74 % | |
4 | 13 % | |
3 | 4 % | |
2 | 0 % | |
1 | 9 % |
고객 리뷰
May 13, 2026
Just a note to say thank you to the creator for making this free of charge. Appreciate it.
March 23, 2026
It's great, Thank you! Can you pls make an update, it doesnt work fully on Indices on CFD
March 9, 2026
"Thank you very much for your work on Order Flow Tick 2.0. It is truly excellent and unique."
October 22, 2025
this is great, i just can't see all the options because the panel is cut short. i don't have access to the bubbles and other features that are apparently there in the code
September 27, 2025
August 3, 2025
Amazing indicator! Once you learn how to use it it really helps out so much, love it!
July 9, 2025
Pros: Real-time tick flow visualization with buy/sell separation. Helps assess market activity and hidden liquidity. Easy to set up, works stable on major assets. Cons: No alerts on tick spikes. No history or tooltips. Requires experience to interpret data correctly.
July 3, 2025
June 20, 2025
Great indicator. It takes a bit of work to learn how to use it properly. Not to be used in isolation, you need to plan potential reversal zones.
April 15, 2025
This looks promising! I tested it out manually, but I would love to automate it! How could we get the source code? :) Really, Pls.
상담
자주 묻는 질문(FAQ)
VWAP
트레이딩 봇, 지표, 플러그인 등 cTrader Store에서 제공되는 상품은 제3자 개발자에 의해 제공되며, 이는 단순히 정보 및 기술적 접근을 목적으로 제공된 것입니다. cTrader Store는 중개인이 아니며, 투자 조언, 개인별 추천 또는 향후 성과에 대한 어떠한 보장도 제공하지 않습니다.


좋아하실 만한 다른 항목


가격
가입일 12/12/2024
1
판매
33.17K
무료 설치