
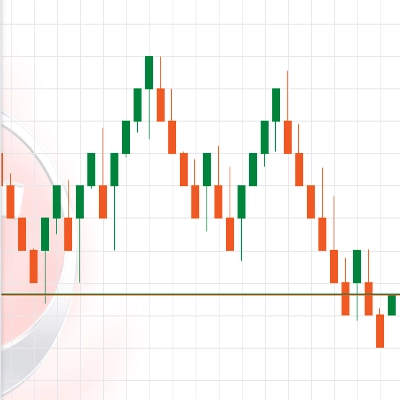
설명
마지막 업데이트 -> 15/09/2025
고성능 심지
rev.1의 새로운 점은?
모든 "Order Flow Aggregated" 관련 개선사항 포함
- 고성능 GetWicks()
- 비동기 틱 데이터 수집
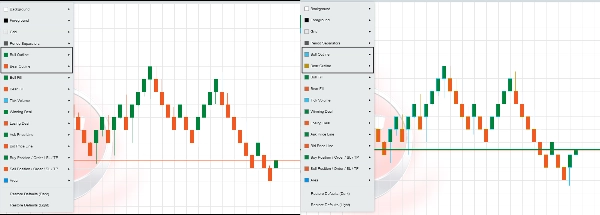
다음으로 심지 색상을 "Bull/Bear Outline Color"에서 변경할 수 있습니다. 차트의 "Colour Options"에서.
틱 데이터를 사용하여 심지를 계산합니다:
상단 심지 = 바가 형성되는 동안 존재하는 최저가 (OpenTime과 CloseTime 사이)
하단 심지 = 바가 형성되는 동안 존재하는 최고가 (OpenTime과 CloseTime 사이)
==============================
항상 먼저 업데이트되는 cTrader의 Store 버전을 선호하세요.
제가 개발한 모든 지표 는 오픈 소스입니다. 코드에 접근할 수 없다면, 다음 Github 저장소를 확인하세요.
요약
AI 요약
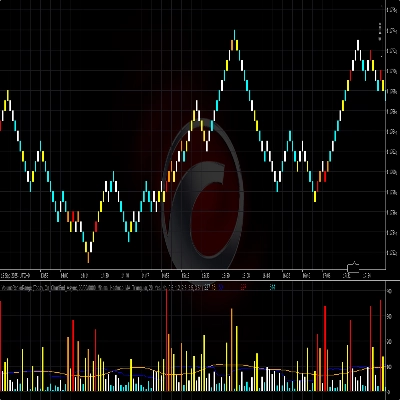
Renko Wicks is a high-performance indicator designed for use with Renko charts on the cTrader platform. It calculates and displays dynamic wicks on Renko bricks by analyzing tick data within each bar’s formation period. Specifically, the indicator determines the Up Wick as the lowest price recorded between the bar’s open and close times, and the Down Wick as the highest price in the same interval. This approach provides a detailed view of price extremes during each Renko bar formation.
Users can customize wick colors dynamically by adjusting the Bull/Bear Outline Color settings in the chart’s Color Options. The indicator incorporates asynchronous tick data collection and optimized wick calculation methods for improved performance. It is not a custom chart but overlays trendlines on Renko bricks based on the described logic.
Renko Wicks is open source, with code available on GitHub, and integrates improvements related to order flow aggregation. It complements other volume and order flow indicators available on the cTrader Store. The indicator supports detailed price action analysis on Renko charts, aiding traders in visualizing price extremes within each brick formation period.
Users can customize wick colors dynamically by adjusting the Bull/Bear Outline Color settings in the chart’s Color Options. The indicator incorporates asynchronous tick data collection and optimized wick calculation methods for improved performance. It is not a custom chart but overlays trendlines on Renko bricks based on the described logic.
Renko Wicks is open source, with code available on GitHub, and integrates improvements related to order flow aggregation. It complements other volume and order flow indicators available on the cTrader Store. The indicator supports detailed price action analysis on Renko charts, aiding traders in visualizing price extremes within each brick formation period.
지표 프로필
고객 리뷰
4.6
리뷰: 5
5 | 60 % | |
4 | 40 % | |
3 | 0 % | |
2 | 0 % | |
1 | 0 % |
고객 리뷰

August 24, 2025
July 23, 2025
July 14, 2025
Pros: Adds high/low wick info to Renko charts, improving price action clarity. Lightweight and stable. Cons: Limited customization. No tooltips or alerts. Works only with Renko chart types.

상담
자주 묻는 질문(FAQ)
VWAP
트레이딩 봇, 지표, 플러그인 등 cTrader Store에서 제공되는 상품은 제3자 개발자에 의해 제공되며, 이는 단순히 정보 및 기술적 접근을 목적으로 제공된 것입니다. cTrader Store는 중개인이 아니며, 투자 조언, 개인별 추천 또는 향후 성과에 대한 어떠한 보장도 제공하지 않습니다.

















가격

가입일 12/12/2024
2
판매
36.62K
무료 설치