
Tick Bubbles
Indicator
Version 1.1, Oct 2026
Windows, Mac
5.0
Reviews: 1

Since 12/12/2024
2
Sales
37.65K
Free installs
Description
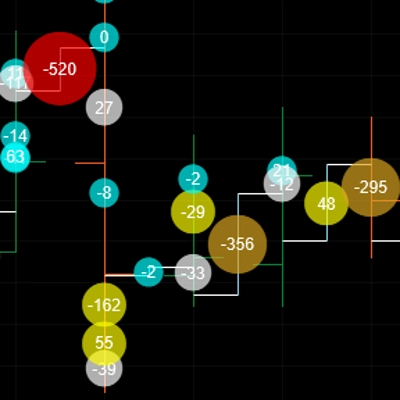
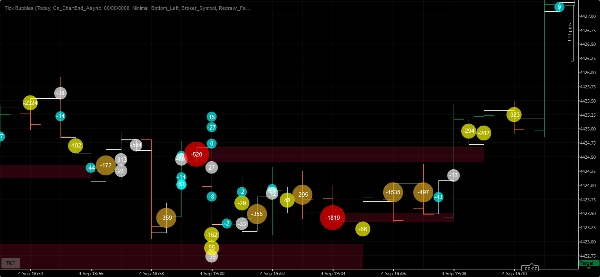
Take your price action and volume analysis to the next level with Tick Bubbles, a precision-engineered order-flow indicator designed exclusively for cTrader.
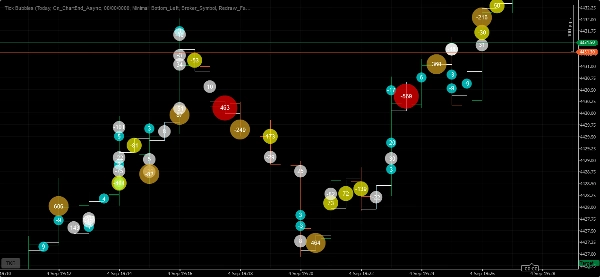
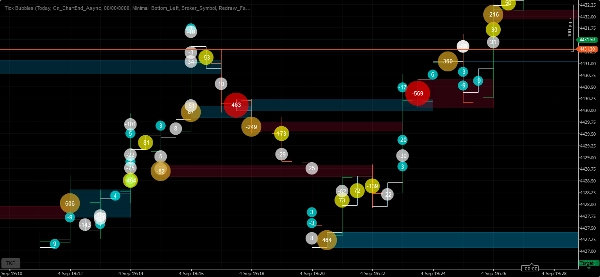
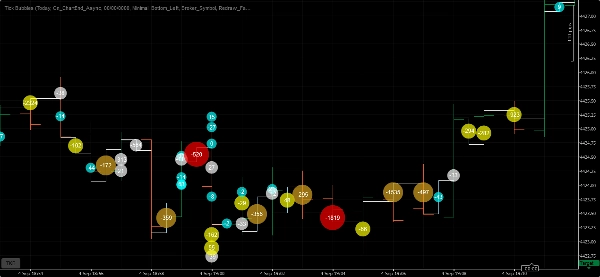
By translating tick-level data into dynamic, weighted visual clusters directly on your chart, Tick Bubbles allows you to spot institutional footprints, liquidity imbalances, and hidden market absorption in real-time.
Whether you are scalping volatile forex pairs or trading index futures, Tick Bubbles cuts through the chart noise to show you where aggressive volume is entering the market.
🚀 Key Features
- Frequency in Pips (Custom Aggregation) Take full control of how your data is displayed. Use the customizable Pip Frequency input to define how price movement triggers bubble plotting. Filter out minor market noise and focus strictly on meaningful volume clusters tailored to your timeframe and trading style.
- High & Ultra Absorption Alerts Stay ahead of market reversals and breakout traps. Tick Bubbles features built-in algorithms that detect heavy buying or selling absorption at key levels. Receive instant pop-up, sound, or push notifications whenever High or Ultra absorption thresholds are breached.
- Dynamic Coloring & Sizing Customization Personalize your workspace with a fully flexible visual engine. Configure custom color palettes to distinguish between aggressive buying pressure and selling pressure, and let the dynamic sizing scale automatically reflect the exact weight of each volume cluster at a glance.
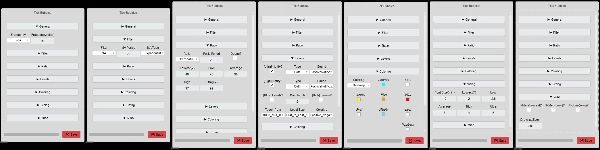
⚙️ Configurable Input Parameters
- Pip Step / Frequency: Sets the price interval (in pips) required to aggregate tick volume.
- Absorption Sensitivity: Adjusts the threshold multipliers for High and Ultra volume events.
- Color Palettes: Choose your preferred color schemes for bullish and bearish clusters.
- Min/Max Bubble Size: Scale the visual radius of the bubbles to keep your charts clean and readable.
Transform raw market ticks into clear visual trading edges. Equip your cTrader platform with Tick Bubbles today and trade with absolute order-flow clarity.
Summary
AI summary
Tick Bubbles is an order-flow indicator designed exclusively for the cTrader platform that visualizes tick-level price and volume data as dynamic, weighted clusters directly on trading charts. It translates raw market ticks into clear visual bubbles, helping traders identify institutional footprints, liquidity imbalances, and hidden market absorption in real time. The indicator supports customizable aggregation by pip frequency, allowing users to filter out minor market noise and focus on significant volume clusters tailored to their trading style and timeframe. Key features include alerts for high and ultra absorption levels, which notify traders of heavy buying or selling pressure that may signal market reversals or breakout traps. Visual customization options enable users to set color palettes distinguishing bullish and bearish volume clusters and adjust bubble sizes for clarity. Configurable input parameters include pip step/frequency for volume aggregation, absorption sensitivity thresholds, color schemes, and minimum/maximum bubble sizes. Tick Bubbles is applicable across various markets, including volatile forex pairs and index futures, providing enhanced order-flow clarity and aiding in price action and volume analysis.
Indicator profile
Indicator category
Market structure (SMC)
Output type
Visualisation
Data requirements
Tick data
Supported signals
Volatility
Discussion
Customer reviews
5.0
Reviews: 1
5 | 100 % | |
4 | 0 % | |
3 | 0 % | |
2 | 0 % | |
1 | 0 % |
Customer reviews
October 23, 2026
Weighted bubbles, pip aggregation and adjustable colours make tick clusters engaging to inspect, with High or Ultra absorption alerts adding useful monitoring without pretending broker ticks identify institutional traders.
FAQ
Imbalance
Volume
Market Structure
ATR
VWAP
Products available through cTrader Store, including trading bots, indicators and plugins, are provided by third-party developers and made available for informational and technical access purposes only. cTrader Store is not a broker and does not provide investment advice, personal recommendations or any guarantee of future performance.







Price
Since 12/12/2024
2
Sales
37.65K
Free installs