
Free Volume Profile v2.0
Indicator
9.64K downloads
Version 1.1, Jan 2026
Windows, Mac
4.7
Reviews: 9
Description
Last Description -> 11/11/2025
What's new in Revision 1?
- Rewritten using related improvements of Order Flow Aggregated/Volume Profile.
- High-Performance VP_Bars
- Concurrent Live VP Update
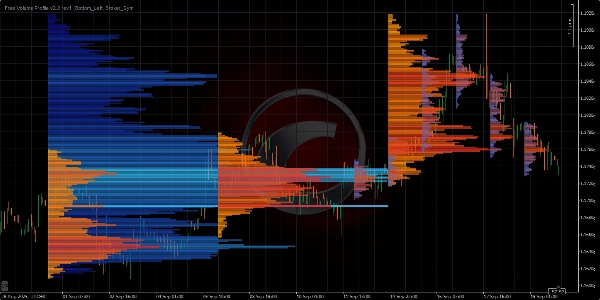
- Show Any or All (Mini-VPs/Daily/Weekly/Monthly) Profiles at once!
- Fixed Range Profiles
- Fix => Params-panel on MacOS
=============================
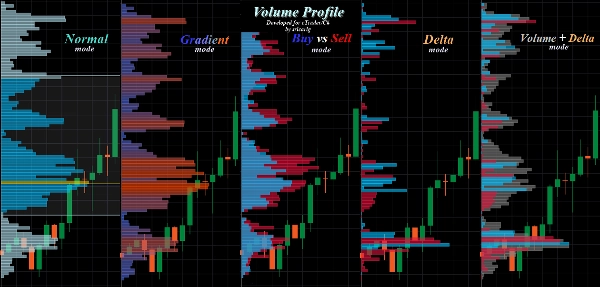
Normal Mode = Volume Profile with Fixed/Gradient Color
Buy vs Sell Mode = The name explains itself
Delta Mode = Volume Delta Profile
The Volume Calculation(Bars Volume Source)
is exported, with adaptations, from the BEST VP I have see/used,
of FXcoder's, author of the famous (Volume Profile + Range v6.0)
a BIG THANKS to HIM!
==============================
Always prefer the cTrader's Store version, it's updated first.
All the indicators I've developed are open source. If you don't have access to the code, check out the Github repository
Summary
AI summary
Free Volume Profile v2.0 is an open-source trading indicator designed for volume-based market analysis. It builds on the core features of the TPO Profile v2.0 but focuses on volume data, integrating functionalities from Order Flow Ticks v2.0. The indicator supports multiple display modes including Normal (volume profile with fixed or gradient colors), Buy vs Sell, Delta (volume delta profile), and a combined Normal+Delta mode.
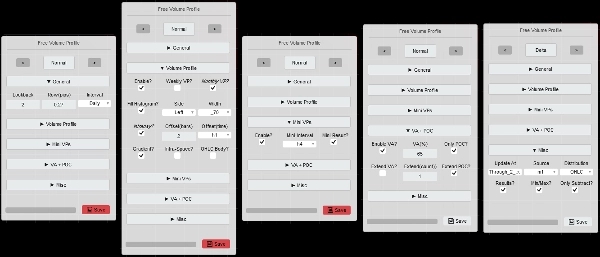
Key features include a parameters panel for quick switching between settings such as volume modes, row height, and intervals, enhancing user-friendliness. It offers high-performance volume profile calculations adapted from FXcoder’s Volume Profile + Range v6.0, with concurrent live updates and the ability to display multiple profiles simultaneously (mini, daily, weekly, monthly). Fixed range profiles are also supported.
The indicator is compatible with Mac OS and requires .NET 6.0 or higher. It is suitable for traders seeking detailed volume distribution insights across various timeframes and supports advanced volume analysis through its integration of order flow and delta volume data. The source code is available on GitHub for transparency and customization.
Indicator profile
Customer reviews
4.7
Reviews: 9
5 | 78 % | |
4 | 22 % | |
3 | 0 % | |
2 | 0 % | |
1 | 0 % |
Customer reviews
April 17, 2026
February 3, 2026
November 4, 2025
Thank you for your excellent work, and for making it free, you are a good person
October 21, 2025
Great indicator but it lags on adding VAs and Moving from Gradient to either BuySell or Delta how to fix this
August 26, 2025
Great tool. It is a little buggy but great feature. Also hoped cTrader would make this native.
July 9, 2025
Pros: Clear manual volume profile for selected range. Shows accumulation zones and POC levels. Stable, customizable, easy to use. Cons: No automatic profile building by time. No history of profiles. Lacks alerts on price touching key levels.
June 21, 2025
Discussion
FAQ
VWAP
Products available through cTrader Store, including trading bots, indicators and plugins, are provided by third-party developers and made available for informational and technical access purposes only. cTrader Store is not a broker and does not provide investment advice, personal recommendations or any guarantee of future performance.


Price
Since 12/12/2024
1
Sales
33.22K
Free installs