
Descrizione
Indicatore Price Jump Exit and Re-entry (PjER) è un indicatore di gestione del rischio basato sull'articolo accademico “A dynamic price jump exit and reentry strategy for intraday trading” di Koegelenberg & van Vuuren (2024), pubblicato su Expert Systems With Applications Journal.
Innovazione Chiave
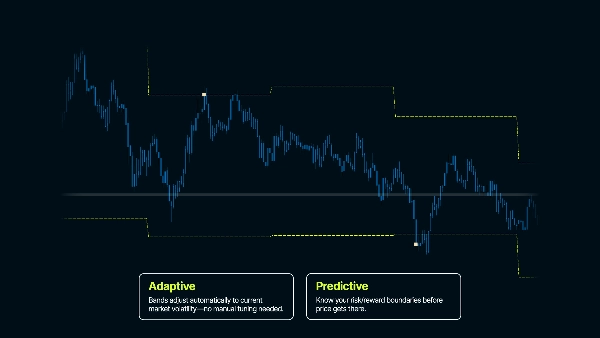
- Stime VaR delle perdite potenziali prima che si verifichino
- Robustezza contro forti trend di mercato su brevi periodi
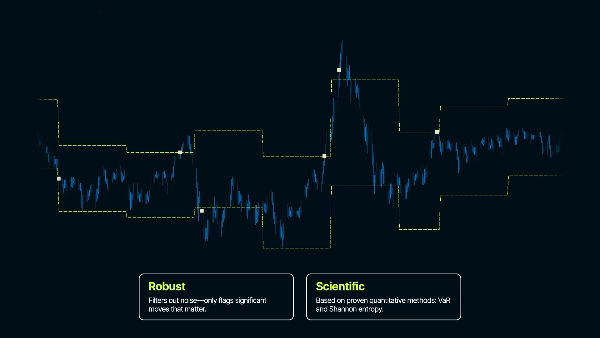
- Analisi della correzione del mercato post-salto per un timing sicuro di rientro
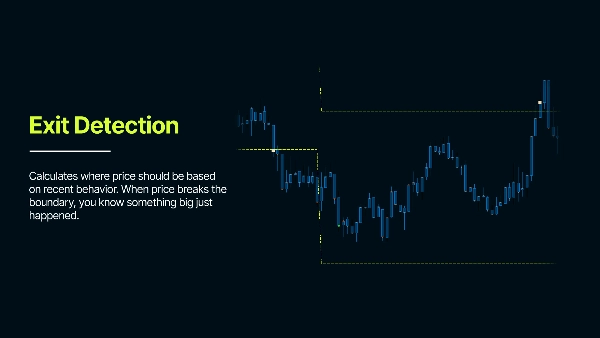
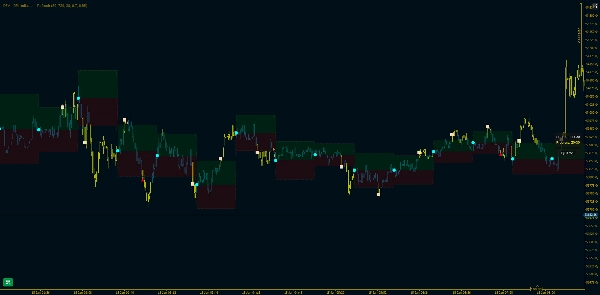
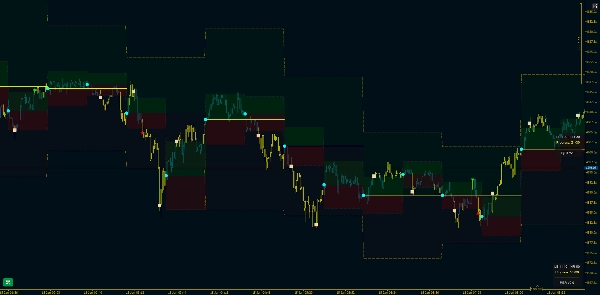
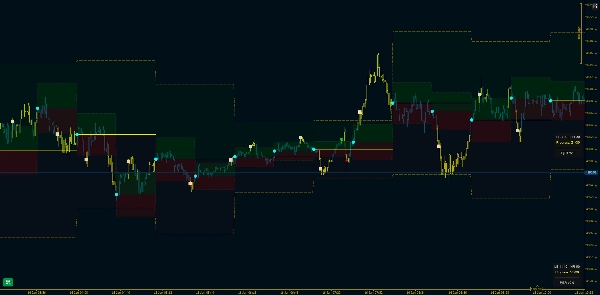
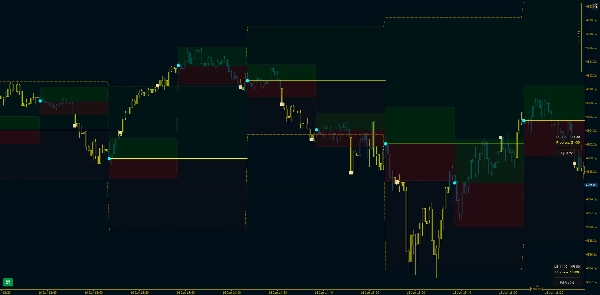
Analizza i movimenti di prezzo passati per comprendere la volatilità tipica e crea intervalli di confidenza - che rappresentano il range di prezzo previsto. Quando il prezzo salta fuori da queste bande segnala che è successo qualcosa di anomalo.
Caso d'Uso Target
Trading intraday (specialmente strategie basate su range). Questo indicatore crea confini statistici attorno al prezzo per rilevare movimenti anomali. Nel comportamento normale del mercato il prezzo rimane entro i range previsti basati sulla volatilità recente. Quando il prezzo rompe queste bande, segnala che sta succedendo qualcosa di insolito - un potenziale punto di uscita da un trade o una rottura nella struttura del mercato, perché il comportamento del mercato è cambiato.
Parametri Principali Spiegati
Max Days Back - Determina quanto indietro nella storia l'indicatore inizia a lavorare
GMT Offset - Si adatta al tuo fuso orario. Garantisce che i calcoli delle date corrispondano al tuo orario locale
Lookback Period (bars)
"Quanta storia del prezzo dovrei usare per misurare il comportamento 'normale'?"
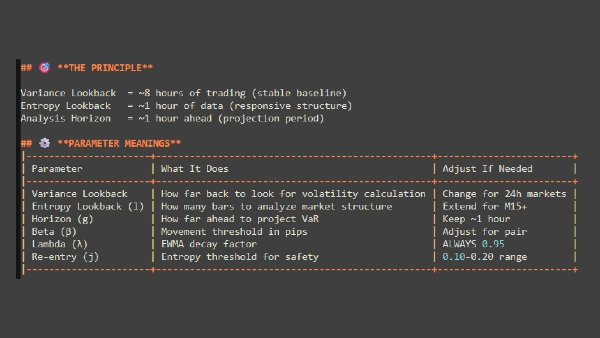
- Quante barre di dati storici usare per calcolare la volatilità
- Più barre = più stabile ma più lento ad adattarsi; meno barre = reazione più veloce ma più rumorosa
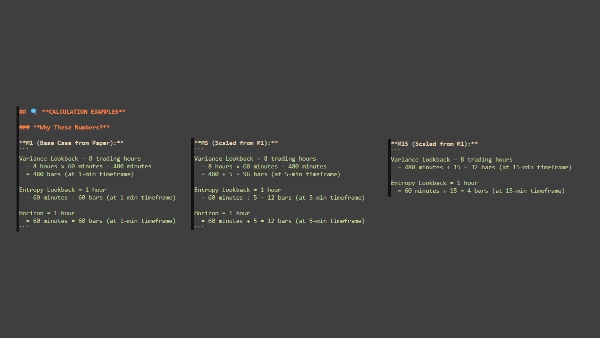
- Esempio: 1440 barre su M1 = 24 ore di dati
Orizzonte di Analisi (bars)
"Per quanto tempo dovrei osservare il prezzo prima di ricominciare da capo?"
- Quanto dura ogni periodo di analisi prima che le bande si resettino
- Imposta il timeframe che stai analizzando - più corto = reset più frequenti, più lungo = bande rimangono fisse più a lungo
- Esempio: 60 barre = le bande rimangono per 60 barre, poi si ricalcolano dal nuovo prezzo di riferimento
Probabilità di Rischio
"Quanto voglio essere sicuro che il prezzo normalmente non raggiunga questi livelli?"
- Imposta il livello di confidenza per le bande (come margine di sicurezza)
- Valori più alti = bande più larghe (meno segnali), valori più bassi = bande più strette (più segnali)
- Esempio: 0.80 = 80% di confidenza che il prezzo rimanga entro le bande in condizioni normali
Fattore di Decadimento (λ - Lambda)
"Devo dare più importanza a ciò che è appena successo o trattare tutta la storia allo stesso modo?"
- Controlla quanto peso dare ai dati recenti rispetto a quelli più vecchi nel calcolo della volatilità
- Valori più alti = i dati recenti contano di più; valori più bassi = tutti i dati pesati più equamente
- Esempio 0.95 = la volatilità recente influenza fortemente il calcolo
PUNTI CHIAVE DA RICORDARE
Questo è uno strumento di GESTIONE DEL RISCHIO – Identifica eventi di volatilità e stabilità nel tempo
Gli intervalli di confidenza sono critici – Le bande NON devono seguire il prezzo come ATR – Le bande sono calcolate per ogni periodo di analisi
Il rientro richiede pazienza – Non aspettarti un rientro immediato dopo l'uscita – Il mercato ha bisogno di tempo per stabilizzarsi
I parametri sono specifici per asset e timeframe – I parametri di default sono punti di partenza – Ottimizza per il tuo mercato e stile specifico – Ciò che funziona nel FX potrebbe non funzionare per Indici, Metalli o Crypto.
( * ) Questo indicatore è fornito solo a scopo educativo e informativo. Non è inteso come consiglio finanziario o di investimento. Nulla in questo prodotto, nella sua documentazione o in materiali correlati deve essere interpretato come una raccomandazione a comprare, vendere o detenere qualsiasi strumento finanziario. Il trading nei mercati finanziari comporta rischi significativi e potrebbe non essere adatto a tutti gli investitori. Le performance passate non sono indicative di risultati futuri. Non vi è alcuna garanzia di profitti e gli utenti possono subire perdite sostanziali. Utilizzando questo indicatore, riconosci di essere l'unico responsabile delle tue decisioni di trading e dei risultati finanziari. Il creatore di questo prodotto non sarà ritenuto responsabile per eventuali perdite o danni derivanti direttamente o indirettamente dal suo utilizzo. Effettua sempre la tua analisi prima di prendere decisioni di trading.
Riepilogo
Key features include Value at Risk (VaR) estimates to anticipate potential losses, robustness against strong short-term trends, and analysis of post-jump corrections to identify safe re-entry timings. Core adjustable parameters allow users to tailor the indicator to specific assets and timeframes, including lookback period for volatility calculation, analysis horizon for band recalculation frequency, risk probability to set confidence levels, and decay factor to weight recent versus older data.
The indicator emphasizes patience for re-entry after exits, as market stabilization is required. It is intended as a tool for identifying volatility events and managing risk rather than providing direct trade signals. Users should optimize parameters according to their trading style and market conditions.
Recensioni dei clienti
5 | 100 % | |
4 | 0 % | |
3 | 0 % | |
2 | 0 % | |
1 | 0 % |


