
QQE
Indicatore
177 download
Versione 1.0, Apr 2025
Windows, Mac
Descrizione
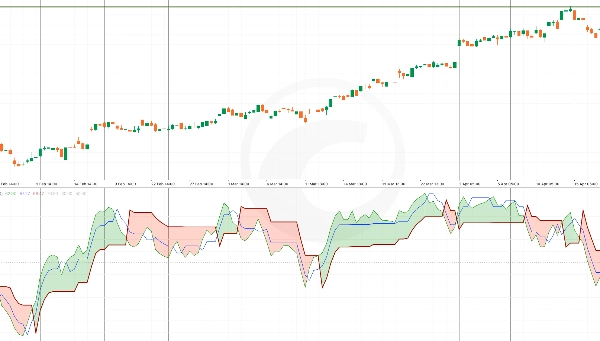
L'indicatore Quantitative Qualitative Estimation (QQE) è uno strumento di analisi tecnica che migliora il Relative Strength Index (RSI) incorporando medie mobili smussate. Aiuta i trader a valutare la forza del trend, potenziali inversioni e condizioni di ipercomprato/ipervenduto con maggiore precisione.
QQE presenta due componenti chiave: i livelli di trailing stop veloce e lento, che agiscono come supporti e resistenze dinamici. Questo lo rende uno strumento versatile sia per strategie di trend-following che di mean-reversion. Un incrocio tra la linea QQE e la sua linea di segnale indica spesso potenziali opportunità di acquisto o vendita.
Riepilogo
Riepilogo AI
The Quantitative Qualitative Estimation (QQE) indicator is a technical analysis tool that enhances the Relative Strength Index (RSI) by integrating smoothed moving averages. It provides improved assessment of trend strength, potential reversals, and overbought or oversold market conditions. The indicator includes two main components: fast and slow trailing stop levels, which serve as dynamic support and resistance points. This design supports both trend-following and mean-reversion trading strategies. Additionally, crossovers between the QQE line and its signal line are used to identify potential buy or sell signals. The QQE indicator is applicable across various markets, including indices, and is categorized under momentum indicators.
Profilo indicatore
Recensioni dei clienti
0.0
Recensioni: 0
Recensioni dei clienti
Questo prodotto non ha ancora ricevuto recensioni. L'hai già provato? Fallo sapere agli altri per primo!
Discussioni
Domande frequenti
Signal
Indices
RSI
I prodotti disponibili tramite cTrader Store, inclusi bot di trading, indicatori e plugin, sono forniti da sviluppatori terzi e resi disponibili esclusivamente a scopo informativo e di accesso tecnico. cTrader Store non è un broker e non fornisce consulenze in materia di investimento, raccomandazioni individualizzate o garanzie di risultati futuri.


![Logo di "Smart Money Concepts (SMC) [Iridio Capital]"](https://cdn.ctrader.com/image/webp/28b69fd1-ef54-4bed-9487-07e78e883be4_40934)

Prezzo
12
Vendite
424
Installazioni gratuite