Descrizione
Pinescritlabs
Indicatori Ctrader Store: 🤖Pinescritlabs Ctrader Store cBots:
Fair Value Gap Sessions Gold & BTC Breakout Session Pivots(nuovo)
Dynamic Market Structure
Analisi dei Punti di Svolta
Fibonacci Linear
Regressione Multi-timeframe
Multi-Level Candle Bias
Tracker
Auto Support and
Resistance Trend Lines
All Support and
Resistance Levels
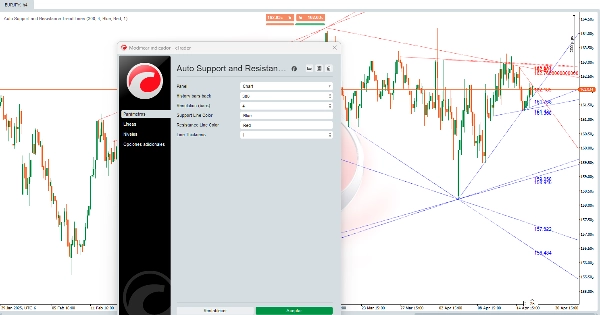
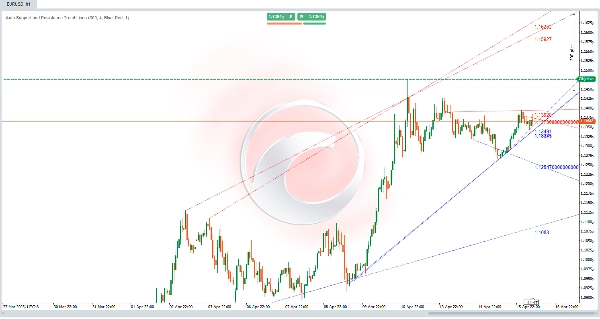
Linee di Tendenza di Supporto e Resistenza Automatiche:
Questo algoritmo è uno strumento potente 🛠️ progettato per identificare automaticamente i livelli di supporto e resistenza su un grafico dei prezzi. Non solo disegna linee orizzontali, ma traccia anche canali diagonali ↗️↘️ che rappresentano le tendenze di mercato. Questi livelli e canali sono aree chiave dove il prezzo ha faticato a salire (resistenza 🚧) o scendere (supporto 🛡️), rendendoli punti cruciali per le decisioni di trading. 📈📉
Come Vengono Effettuati i Calcoli? 🔍
L'algoritmo utilizza un approccio di analisi della storia dei prezzi 📊 per identificare i livelli di supporto e resistenza. Ecco come funziona:
- Identificazione di Minimi e Massimi Locali ⬇️⬆️
-
- L'algoritmo analizza il prezzo su un intervallo specifico di barre (candele) per trovare minimi locali (i prezzi più bassi in quell'intervallo) e massimi locali (i prezzi più alti in quell'intervallo).
- Questi minimi e massimi locali sono candidati potenziali per diventare livelli di supporto e resistenza.
- Validazione dei Livelli ✔️
-
- Una volta identificati minimi e massimi locali, l'algoritmo verifica se questi livelli sono stati rispettati dal prezzo in passato.
- Se il prezzo ha toccato un livello più volte senza superarlo chiaramente, viene considerato un livello valido di supporto o resistenza.
- Disegno di Linee e Canali ✏️
-
- I livelli di supporto sono disegnati come linee orizzontali (o diagonali) ai minimi locali validati.
- I livelli di resistenza sono disegnati come linee orizzontali (o diagonali) ai massimi locali validati.
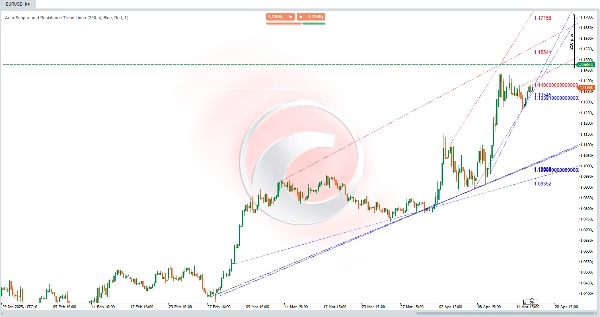
- Inoltre, l'algoritmo collega questi livelli per formare canali diagonali ↗️↘️, che rappresentano tendenze rialziste o ribassiste nel mercato.
- Aggiornamenti Dinamici 🔄
-
- L'indicatore si aggiorna automaticamente ad ogni nuova barra, ricalcolando e ridisegnando i livelli di supporto e resistenza basandosi sul comportamento più recente del prezzo.
Come Aiuta Questo Algoritmo i Trader? 💡
Questo algoritmo è un cambiamento radicale per i trader perché:
- Fornisce una Visione Macro del Mercato 🌐
-
- Disegnando canali diagonali, l'algoritmo mostra le principali tendenze di mercato, aiutando i trader a identificare se il prezzo è in una tendenza rialzista 📈, ribassista 📉, o in un movimento laterale ↔️.
- Identifica Aree Chiave di Supporto e Resistenza 🎯
-
- I livelli di supporto e resistenza sono zone dove il prezzo può rimbalzare o rompere. Questi livelli sono utili per:
-
- Impostare punti di ingresso e uscita per le operazioni.
- Posizionare stop-loss 🛑 e take-profit ✅ ordini.
- Identificare breakout 🚀 o inversioni 🔄 nel prezzo.
- Semplifica l'Analisi Tecnica 🕒
-
- L'algoritmo automatizza il processo di identificazione di supporto e resistenza, risparmiando tempo ai trader che eseguono analisi manuali.
- Mostrando chiaramente livelli e canali, aiuta i trader a prendere decisioni più informate.
- Personalizzabile 🎨
-
- I trader possono regolare parametri come il numero di barre storiche analizzate, spessore delle linee, e colori, permettendo all'indicatore di essere adattato a diversi stili di trading e preferenze visive.
Esempio Pratico 📌
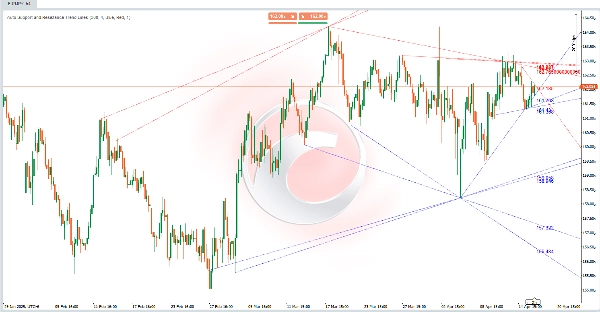
Immagina di analizzare un grafico dei prezzi, e l'algoritmo ha disegnato:
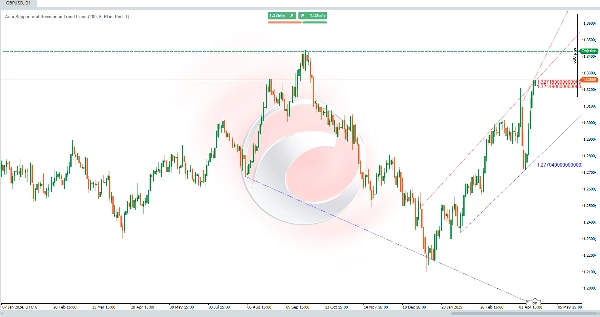
- Una linea di supporto diagonale ↗️ che collega diversi minimi locali, indicando una tendenza rialzista.
- Una linea di resistenza diagonale ↗️ che collega diversi massimi locali, mostrando un canale ascendente.
- Diverse linee orizzontali che rappresentano livelli chiave di supporto e resistenza.
Con queste informazioni, puoi:
- Identificare che il prezzo è in una tendenza rialzista 📈.
- Cercare opportunità di acquisto vicino alla linea di supporto diagonale o ai livelli di supporto orizzontali.
- Impostare uno stop-loss 🛑 sotto il livello di supporto più vicino.
- Osservare se il prezzo rompe la resistenza per confermare la continuazione della tendenza o un potenziale inversione 🔄.
Riepilogo
Once validated, support and resistance levels are drawn as horizontal or diagonal lines, and connected to form channels indicating bullish or bearish trends. The indicator updates dynamically with each new bar, recalculating and redrawing levels to reflect the most recent price behavior.
This tool aids traders by providing a macro view of market trends, identifying zones where price may bounce or break, and simplifying technical analysis through automation. It supports setting entry and exit points, stop-loss and take-profit orders, and spotting potential breakouts or reversals. Parameters such as the number of historical bars analyzed, line thickness, and colors can be customized to fit different trading styles and preferences.