
50 percent
Indicatore
Versione 1.0, Aug 2025
Windows, Mac
5.0
Recensioni: 2

Descrizione
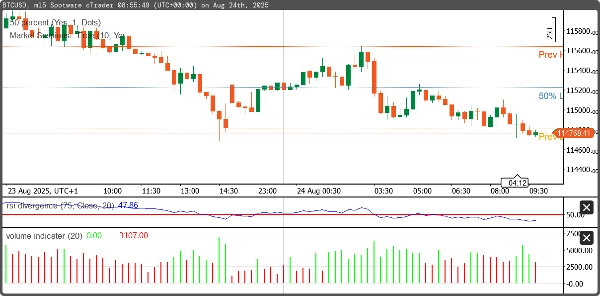
Questo cBot rileva automaticamente i prezzi massimi e minimi della sessione precedente e calcola il punto medio tra di essi. È progettato per assistere i trader identificando le principali zone di supporto/resistenza e i livelli di equilibrio di mercato, spesso utilizzati per strategie di inversione o breakout.
- Rileva il massimo e il minimo del giorno (o della sessione) precedente.
- Calcola il punto medio tra il massimo e il minimo.
- Traccia i livelli di massimo, minimo e punto medio sul grafico.
Riepilogo
Profilo indicatore
Recensioni dei clienti
5.0
Recensioni: 2
5 | 100 % | |
4 | 0 % | |
3 | 0 % | |
2 | 0 % | |
1 | 0 % |
Recensioni dei clienti
August 29, 2025
The screen feels less crowded, but the final call still needs say no.
August 20, 2025
Discussioni
Domande frequenti
I prodotti disponibili tramite cTrader Store, inclusi bot di trading, indicatori e plugin, sono forniti da sviluppatori terzi e resi disponibili esclusivamente a scopo informativo e di accesso tecnico. cTrader Store non è un broker e non fornisce consulenze in materia di investimento, raccomandazioni individualizzate o garanzie di risultati futuri.
Altro da questo autore


Prezzo
Da 14/05/2025
10.1M
Volume negoziato
81.44K
Profitto in pip
205
Installazioni gratuite