
Volume Profile Pro
Индикатор
8 покупки
Версия 1.0, Oct 2025
Windows, Mac
5.0
Отзывы: 3
Описание
Volume Profile Pro — это профессиональный инструмент анализа объема с фиксированным диапазоном, предназначенный для точного отображения структуры рынка и ликвидности.
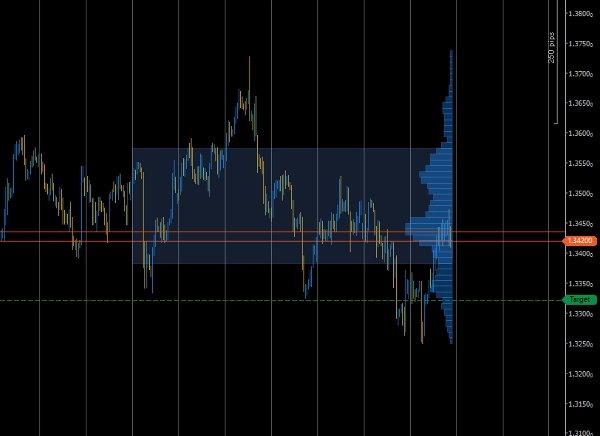
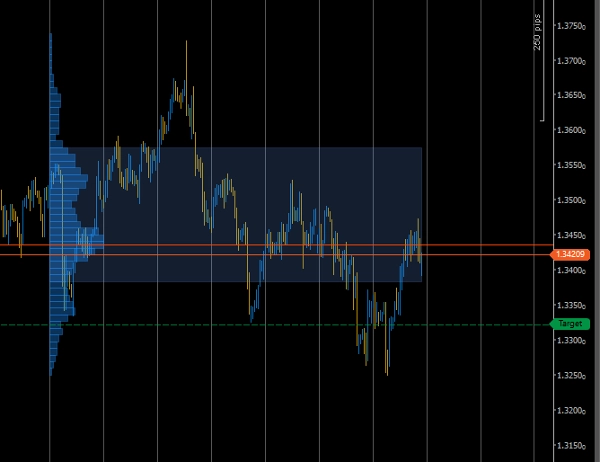
Он позволяет визуализировать, сколько торговой активности произошло на каждом ценовом уровне в пределах заданного диапазона графика — помогая мгновенно определить зоны интереса, такие как узлы с высоким объемом, Точка контроля (POC) и 70% зона стоимости.
Основные функции
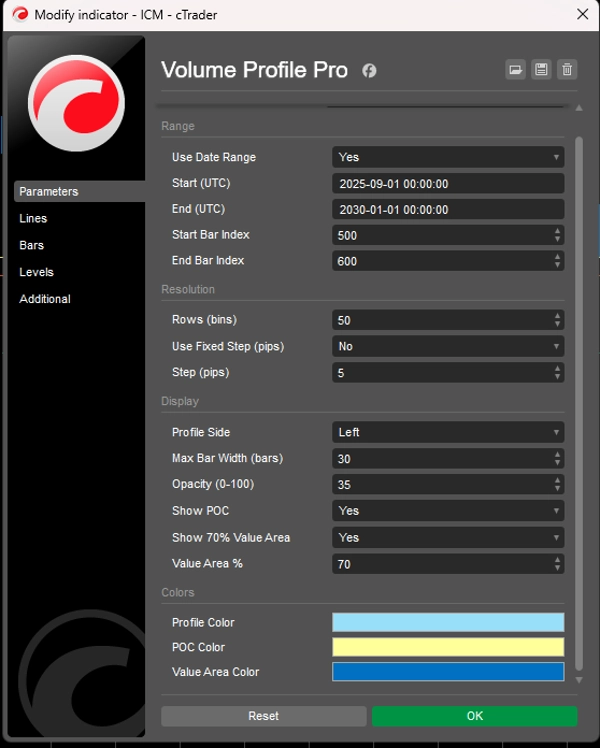
- 🧭 Выбор фиксированного диапазона – Определяйте пользовательский диапазон по дате или индексу бара для анализа только интересующей вас области.
- 📊 Точное распределение объема – Строит гистограмму объема на основе тикового объема в выбранном диапазоне.
- 🎯 POC и зона стоимости – Автоматически выделяет Точку контроля и полосу зоны стоимости в 70%.
- ⚙️ Гибкое разрешение – Регулируемое количество корзин или фиксированный шаг в пипсах для индивидуальной детализации.
- 🎨 Чистая визуализация – Выбор стороны (левая/правая), масштабирование ширины и прозрачность для оптимальной читаемости графика.
- ⚡ Легкий и оптимизированный – Эффективные вычисления для исследований объема в реальном времени без замедления терминала.
Как это работает
- Выберите, использовать ли диапазон дат или диапазон индексов баров.
- Задайте параметры начала и конца.
- Индикатор вычисляет тиковый объем на каждом ценовом шаге и строит горизонтальные бары, показывающие относительную активность.
- Самый длинный бар отмечает POC, а слегка затемненная область показывает зону стоимости (по умолчанию 70%).
Идеально подходит для
- Дневных и свинг-трейдеров, анализирующих концентрацию ликвидности.
- Разработчиков стратегий на основе объема, ищущих зоны, основанные на данных.
- Трейдеров, использующих развороты/уровни совпадения POC или зоны стоимости.
Сводка
ИИ-сводка
Volume Profile Pro is a fixed-range volume analysis indicator designed to visualize trading volume distribution by price within a user-defined chart range. It calculates tick volume at each price level and displays a horizontal histogram that highlights key market structure elements such as the Point of Control (POC)—the price with the highest traded volume—and the 70% Value Area, representing the price range where most trading activity occurred. Users can select the analysis range by date or bar index and adjust the resolution through customizable bin counts or fixed pip steps. The indicator offers flexible visualization options, including side placement, width scaling, and opacity adjustments, to enhance chart readability. Its efficient computation supports real-time volume studies without impacting terminal performance. Volume Profile Pro is suitable for intraday and swing traders, volume-based strategy developers, and those utilizing POC or Value Area levels for trading decisions. It supports multiple markets and symbols, including Forex pairs (EURUSD, GBPUSD, NZDUSD, USDJPY), cryptocurrencies (BTCUSD), commodities (XAUUSD), indices (NAS100), and stocks.
Профиль индикатора
Отзывы покупателей
5.0
Отзывы: 3
5 | 100 % | |
4 | 0 % | |
3 | 0 % | |
2 | 0 % | |
1 | 0 % |
Отзывы покупателей
October 20, 2025
Practical market note if the trader wants it adds useful information behind the price move. It works best as support, not a final decision maker. Volume context is stronger when POC, VWAP and value area agree across 2 sessions. volume alone can be noisy without price action.
October 19, 2025
October 19, 2025
Focused demo option for traders who want confirmation beyond candles. It gives value around volume based context, but volume alone can be noisy without price action. I would review 20 reactions near POC or VWAP before trusting the read. The data helps most when price action confirms the same zone.
Обсуждение
Частые вопросы
BTCUSD
Prop
Forex
Indices
Commodities
Crypto
Stocks
Продукты, доступные в cTrader Store, включая торговых ботов, индикаторы и плагины, предоставляются сторонними разработчиками и доступны исключительно в информационных и технических целях. cTrader Store не является брокером и не предоставляет инвестиционные консультации, персональные рекомендации или какие-либо гарантии будущей доходности.


Цена
С 31/10/2024
56
Продажи
1.75K
Бесплатные установки