
dark-cloud
Индикатор
184 скачивания
Версия 1.0, Mar 2025
Windows, Mac
Описание
Индикатор Dark Cloud Cover — это инструмент технического анализа, предназначенный для выявления потенциальных медвежьих разворотных моделей на рынке. Эта модель состоит из двух последовательных свечей:
- Бычья (зелёная) свеча, сигнализирующая о сильном покупательском импульсе.
- Медвежья (красная) свеча, которая открывается выше закрытия предыдущей, но закрывается ниже середины предыдущей свечи, указывая на давление продавцов.
Эта формация указывает на возможное изменение настроений на рынке, когда покупатели теряют контроль, а продавцы берут верх.
Особенности и функциональность:
- Обнаружение модели:
-
- Индикатор сканирует наличие модели Dark Cloud Cover на основе ценового действия свечей.
- При обнаружении он визуально выделяет модель для оповещения трейдеров.
- Фильтр тренда (опционально):
-
- Для повышения точности индикатор включает опциональный фильтр тренда с использованием скользящей средней (MA).
- Если включён, модель считается действительной только при восходящем тренде.
- Логика подтверждения:
-
- Индикатор может подтвердить медвежий сигнал, проверяя следующую свечу.
- Свеча подтверждения определяется, если она закрывается ниже минимума Dark Cloud Cover и имеет больший объём тиков, чем средний за последние свечи.
- Это обеспечивает большую надёжность сигнала.
- Визуальные маркеры:
-
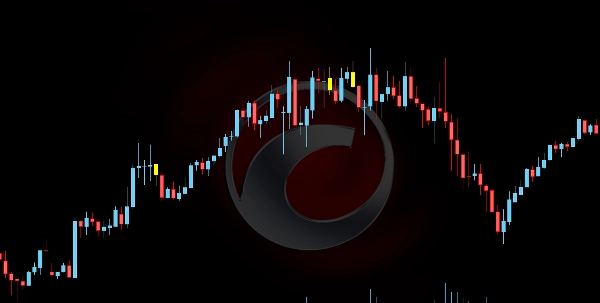
- Жёлтые свечи: отмечают обнаруженную модель Dark Cloud Cover.
- Оранжевые свечи: выделяют свечу подтверждения при выполнении условий по объёму.
Этот индикатор помогает трейдерам выявлять разворотные модели с высокой вероятностью, улучшая принятие решений для коротких позиций или стратегий управления рисками.
Сводка
ИИ-сводка
The Dark Cloud Cover indicator is a technical analysis tool that identifies a specific bearish reversal candlestick pattern. This pattern consists of two candles: a bullish (green) candle indicating strong buying momentum, followed by a bearish (red) candle that opens above the previous close but closes below the midpoint of the prior candle, signaling selling pressure and a potential shift from buyers to sellers.
Key features include:
- **Pattern Detection:** Automatically scans for the Dark Cloud Cover pattern based on candlestick price action and visually highlights detected patterns for trader awareness.
- **Optional Trend Filter:** Incorporates a Moving Average (MA) filter to validate patterns only during uptrends, enhancing signal accuracy.
- **Confirmation Logic:** Validates bearish signals by analyzing the subsequent candle, which must close below the pattern’s low with higher-than-average tick volume to confirm the reversal.
- **Visual Markers:** Uses yellow candles to mark detected patterns and orange candles to highlight confirmation candles meeting volume criteria.
This indicator assists traders in recognizing high-probability bearish reversal setups, supporting decision-making for short entries and risk management strategies.
Профиль индикатора
Отзывы покупателей
0.0
Отзывы: 0
Отзывы покупателей
У этого продукта еще нет отзывов. Уже попробовали его? Поделитесь впечатлениями!
Обсуждение
Частые вопросы
Signal
Продукты, доступные в cTrader Store, включая торговых ботов, индикаторы и плагины, предоставляются сторонними разработчиками и доступны исключительно в информационных и технических целях. cTrader Store не является брокером и не предоставляет инвестиционные консультации, персональные рекомендации или какие-либо гарантии будущей доходности.
Больше от этого автора


![Логотип продукта "[Stellar Strategies] MARSI Signal Plotter"](https://cdn.ctrader.com/image/webp/7b2b8da6-8f8e-4646-8d4a-4710c516c01e_25567)
![Логотип продукта "[CB] Pivot Points Pro"](https://cdn.ctrader.com/image/webp/43463c82-67b0-4f10-a4ba-901bba091d81_32594)
Цена
5
Продажи
433
Бесплатные установки