
Описание
📌 Особенности и функциональность
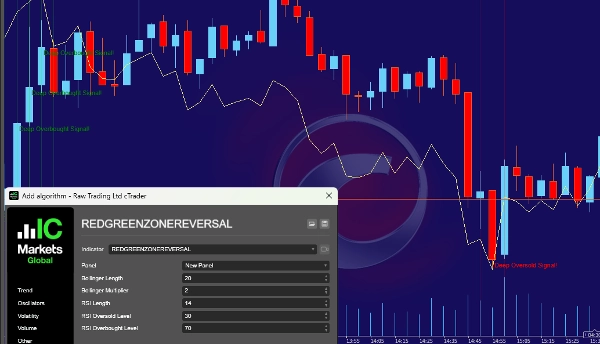
- Полосы Боллинджера (SMA за 20 периодов со стандартным отклонением 2)
-
- Верхняя полоса: указывает на уровни перекупленности.
- Нижняя полоса: указывает на уровни перепроданности.
- Индекс относительной силы (RSI) (14 периодов)
-
- RSI выше 70 → рынок перекуплен (чрезмерное давление покупателей).
- RSI ниже 30 → рынок перепродан (чрезмерное давление продавцов).
- Обнаруживает зоны разворота:
-
- Красная зона (перепроданность):
-
- Цена закрытия ниже нижней полосы Боллинджера.
- RSI ниже 30 (сильное давление продавцов).
- Значение: рынок перепродан, возможность для покупки.
- Зеленая зона (перекупленность):
-
- Цена закрытия выше верхней полосы Боллинджера.
- RSI выше 70 (сильное давление покупателей).
- Значение: рынок перекуплен, возможность для продажи.
- Визуальные маркеры на графике:
-
- Красная затененная зона при перепроданности (возможность для покупки).
- Зеленая затененная зона при перекупленности (возможность для продажи).
- Оповещения и звуковые сигналы:
-
- Текст появляется на графике («Глубокий сигнал перепроданности!» или «Глубокий сигнал перекупленности!»).
- Проигрываются звуковые уведомления при обнаружении состояния перекупленности/перепроданности.
🎯 Как этот индикатор помогает трейдерам?
✅ Предоставляет предупреждающие сигналы о возможных разворотах рынка (на экстремальных ценовых уровнях).
✅ Помогает трейдерам находить сильные точки входа и выхода.
✅ Объединяет полосы Боллинджера и RSI для надежного определения перекупленности/перепроданности.
✅ Подходит для дейтрейдинга, свинг-трейдинга и скальпинга на разных таймфреймах.
🚀 Резюме:
Этот индикатор помогает определять состояния перекупленности и перепроданности и предупреждает о вероятном развороте цены. Трейдеры могут использовать это для принятия разумных решений о покупке и продаже!
🚨 Отказ от ответственности по торговым рискам 🚨
Торговля финансовыми инструментами, включая акции, форекс, криптовалюты, товары и производные инструменты, связана с высоким уровнем риска и не подходит для всех инвесторов. Перед началом любой формы торговли важно понимать связанные риски и тщательно оценивать свое финансовое положение, опыт и уровень допустимого риска.
Рынки могут быть очень волатильными, а ценовые движения — резкими и непредсказуемыми из-за выхода экономических данных, геополитических событий, настроений рынка или неожиданных новостей. Эта волатильность может привести к значительной прибыли, но также и к существенным убыткам. Рынок может быстро пойти против вашей позиции, стоп-лоссы и стратегии управления рисками не гарантируют предотвращение убытков, а кредитное плечо может усилить как прибыль, так и убытки, потенциально превысив ваши первоначальные инвестиции.
Нет никаких гарантий, что любая торговая стратегия, технический индикатор или метод приведут к прибыли. Исторические результаты не гарантируют будущих, и прошлые успехи не обеспечивают будущих доходов. Даже профессиональные трейдеры терпят убытки, рыночные условия постоянно меняются, и предсказать будущие движения с уверенностью невозможно. Торговля не должна основываться исключительно на спекуляциях или эмоциях.
Использование кредитного плеча или маржинальной торговли позволяет контролировать большие позиции с меньшим капиталом, но это также значительно увеличивает риск. Кредитное плечо может привести к быстрой потере капитала, маржин-коллы могут вынудить ликвидацию позиций по неблагоприятным ценам, а торговля на марже может привести к потерям, превышающим первоначальный депозит. Кроме того, существуют риски ликвидности и проскальзывания, когда может не быть достаточного количества покупателей или продавцов в данный момент, и ордера могут не исполняться по ожидаемым ценам. Рыночные гэпы могут привести к резким скачкам цен, полностью обходя уровни стоп-лоссов.
Торговля требует дисциплины, терпения и эмоционального контроля. Страх, жадность и чрезмерная уверенность часто приводят к ошибочным торговым решениям, увеличивая вероятность убытков. Эмоциональная торговля может привести к импульсивным и иррациональным решениям, в то время как страх упустить возможность (FOMO) и торговля из мести могут привести к чрезмерному риску. Важно разработать четкую стратегию и придерживаться плана управления рисками.
Необходимо также учитывать регуляторные и юридические риски, так как в разных юрисдикциях действуют разные правила, касающиеся торговли и инвестиций. Некоторые финансовые продукты могут быть недоступны в вашей стране, а изменения в регулировании могут повлиять на рыночные условия. Всегда соблюдайте местные законы и финансовые нормы, торгуйте через надежных и регулируемых брокеров или биржи, избегайте нерегулируемых платформ, которые могут представлять значительные финансовые риски.
Не стоит игнорировать риски, связанные с технологиями, так как торговля сильно зависит от торговых платформ, интернет-соединения и исполнения программного обеспечения. Задержки исполнения из-за медленного интернета или проблем с сервером могут привести к неожиданным убыткам, сбои в системе могут привести к тому, что позиции останутся открытыми дольше, чем планировалось, а кибербезопасность является важным аспектом при использовании онлайн-платформ для торговли.
Важно отметить, что вся торговая информация, индикаторы, сигналы или инструменты предназначены только для образовательных целей и не должны рассматриваться как финансовые советы. Трейдерам следует проводить собственные исследования и, при необходимости, консультироваться с лицензированным финансовым консультантом перед принятием инвестиционных решений. Ни один индикатор или стратегия не гарантируют стабильную прибыль, и ответственность за все торговые решения лежит исключительно на самом трейдере.
Самое важное правило в торговле — никогда не торговать деньгами, которые вы не можете позволить себе потерять. Торговля по своей природе рискованна, и убытки могут превысить первоначальные инвестиции. Торгуйте только свободными средствами, которые вы готовы потерять, никогда не используйте заемные деньги или средства, необходимые для жизни, и диверсифицируйте свои инвестиции, чтобы не вкладывать все средства в одну сделку или актив.
Торговля — это деятельность с высоким уровнем риска и не должна рассматриваться как основной источник дохода. Многие трейдеры теряют деньги, и лишь небольшой процент достигает долгосрочной прибыльности. Принимайте обоснованные решения, управляйте рисками и всегда торгуйте ответственно. Используя любую торговую платформу, инструменты или индикаторы, вы признаете и принимаете риски, связанные с торговлей.
Торгуйте ответственно. Будьте информированы. Защищайте свой капитал. 🚀
Сводка
- Red Zone (Oversold): Closing price below the lower Bollinger Band and RSI below 30, signaling strong selling pressure and a potential buying opportunity.
- Green Zone (Overbought): Closing price above the upper Bollinger Band and RSI above 70, indicating strong buying pressure and a potential selling opportunity.
Visual markers include red-shaded zones for oversold conditions and green-shaded zones for overbought conditions. Alerts are provided via on-chart text notifications ("Deep Oversold Signal!" or "Deep Overbought Signal!") and sound signals when these conditions occur.
This tool assists traders by providing warning signals for potential market reversals at extreme price levels, helping to identify strong entry and exit points. It is suitable for various trading styles, including day trading, swing trading, and scalping, across different timeframes. The indicator supports markets such as forex, stocks, indices, and commodities.
Отзывы покупателей
5 | 100 % | |
4 | 0 % | |
3 | 0 % | |
2 | 0 % | |
1 | 0 % |


![Логотип продукта "[Stellar Strategies] QQE"](https://cdn.ctrader.com/image/webp/e702104a-874c-4b39-97dd-fb34518d1015_27712)


