
Opis
PVA (Analiza Cena-Objętość) to podejście analizy technicznej, które bada związek między ceną a wolumenem obrotu aktywem finansowym. Główną ideą PVA jest to, że wolumen obrotu może dostarczyć ważnych informacji o sile i kierunku trendu, pomagając traderom podejmować bardziej świadome decyzje.
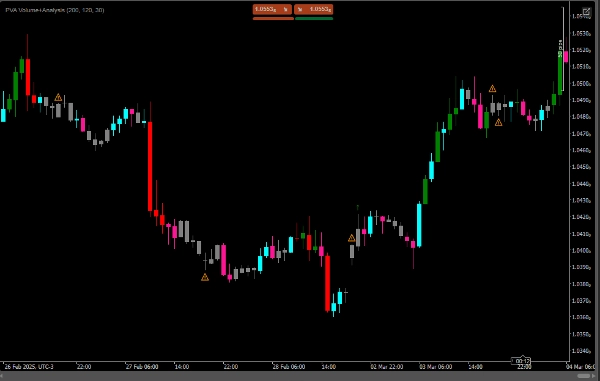
-Rosnący wolumen przy rosnącej cenie: Wskazuje na silny trend wzrostowy, a wyświetlany jest zielony symbol (strzałka w górę).
-Rosnący wolumen przy spadającej cenie: Wskazuje na silny trend spadkowy, a wyświetlany jest czerwony symbol (strzałka w dół).
-Malejący wolumen przy rosnącej cenie: Wskazuje, że trend wzrostowy może tracić na sile, a wyświetlane jest pomarańczowe ostrzeżenie (symbol ostrzegawczy).
-Malejący wolumen przy spadającej cenie: Wskazuje, że trend spadkowy może tracić na sile, a także wyświetlane jest pomarańczowe ostrzeżenie (symbol ostrzegawczy).
-Jeśli wolumen spada podczas ruchu w górę lub w dół, rysowany jest znak ostrzeżenia (⚠️).
Podsumowanie
- A green up arrow appears when volume increases alongside rising prices, indicating a strong uptrend.
- A red down arrow signals a strong downtrend when volume increases as prices fall.
- An orange warning symbol alerts when volume decreases during rising or falling prices, suggesting the current trend may be weakening.
- A general alert mark (⚠️) is displayed if volume declines during either upward or downward price movements.
This indicator assists traders by highlighting the interplay between price and volume, offering insights into the momentum behind market trends. It is designed for use in technical analysis to support more informed trading decisions.
Opinie klientów
5 | 100 % | |
4 | 0 % | |
3 | 0 % | |
2 | 0 % | |
1 | 0 % |


