
Zero Lag Exponential Moving Average
지표
259 다운로드
버전 1.0, Aug 2025
Windows, Mac
설명
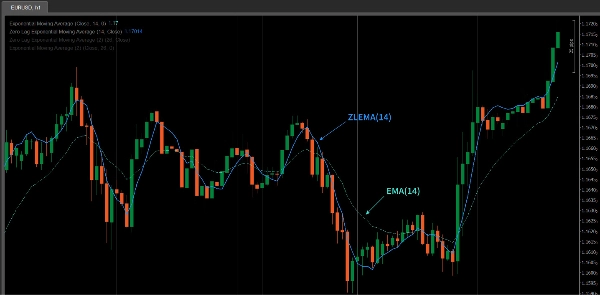
ZLEMA(제로 랙 지수 이동 평균)는 전통적인 EMA에서 흔히 발생하는 지연을 줄이기 위해 고안된 지수 이동 평균(EMA)의 고급 버전입니다. 특수한 계산 방법을 사용하여 ZLEMA는 가격 변동에 더 빠르게 반응하여 변동성이 큰 시장에서 특히 효과적입니다.
ZLEMA의 주요 특징은 "제로 랙" 특성으로, 빠르게 움직이는 시장 상황에서 가격 움직임을 더 밀접하게 따라갈 수 있습니다. 전통적인 EMA와 비교할 때 ZLEMA는 더 빠른 반응 속도를 제공하여 시장 추세를 보다 적시에 포착할 수 있습니다.
ZLEMA 대 EMA
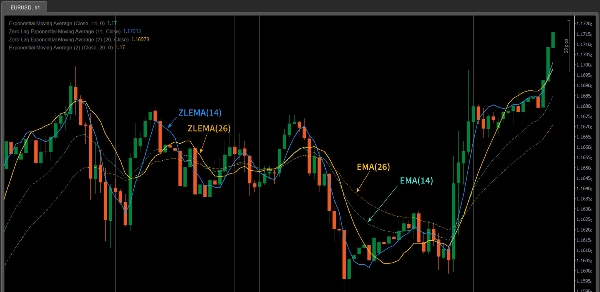
- 반응 속도: ZLEMA는 전통적인 EMA보다 더 빠르게 반응합니다. 지연을 보상하여 가격 변동을 더 신속하게 따라갑니다.
- 평활 효과: ZLEMA는 EMA와 유사한 평활 효과를 유지하면서 가격 지연을 최소화하여 빠르게 움직이는 시장에 더 적합합니다.
- 사용 사례: 단기 또는 당일 거래와 같은 변동성이 큰 시장에서 거래하는 경우, ZLEMA는 반응성 측면에서 EMA보다 우수할 수 있습니다.
ZLEMA 지표의 특징
- 제로 랙 반응: ZLEMA는 지연을 줄여 시장 가격 변동에 빠르게 반응할 수 있어 급격한 시장 변화를 포착하는 데 더 정확합니다.
- 부드러움: 더 빠른 반응성을 제공하면서도 ZLEMA는 EMA의 평활 효과를 유지하여 가격 변동으로 인한 잡음을 피하는 데 도움을 줍니다.
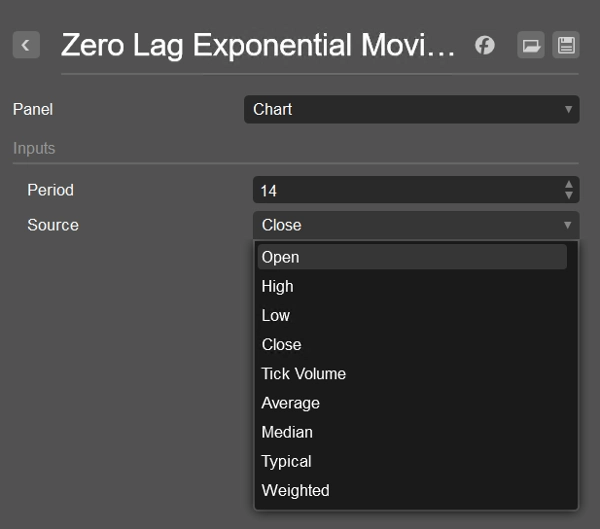
- 유연성: ZLEMA는
종가,시가,고가등 다양한 가격 데이터 소스와 함께 사용할 수 있어 거래자가 전략에 맞게 조정할 수 있습니다. - 추세 추종 및 반전 신호 확인: ZLEMA는 특히 변동성이 큰 시장에서 추세 변화를 식별하고 가격 반전 신호를 확인하는 데 이상적입니다.
ZLEMA 지표 사용 방법
- 단기 거래자: ZLEMA는 가격 변동에 빠르게 반응할 수 있어 단기 거래자에게 적합합니다. 빠른 반응 속도로 단기 추세 반전이나 돌파 신호를 포착하는 데 이상적입니다.
- 추세 추종: ZLEMA는 장기 추세 추적에도 사용할 수 있지만 EMA보다 더 민감합니다. 강한 추세에서는 ZLEMA가 추세의 시작 또는 끝을 더 빠르게 식별하여 적시에 전략 조정을 돕습니다.
- 다른 지표와의 결합: ZLEMA는 RSI, MACD 또는 가격 패턴 분석과 같은 다른 기술 지표와 결합하여 신호 정확도를 높일 때 효과적입니다. 특히 이동 평균과 같은 추세 추종 지표와 결합하여 가격 돌파 또는 반전을 확인하는 데 유용합니다.
- 돌파 및 반전 확인: ZLEMA는 주요 수준에서의 가격 돌파 또는 반전 신호를 확인하는 데 도움을 줄 수 있습니다. 예를 들어, 가격이 ZLEMA 라인을 교차할 때 추세 변화가 나타날 수 있습니다.
- 잡음 감소: 지연이 줄어들어 ZLEMA는 전통적인 이동 평균에서 발생할 수 있는 잡음을 더 잘 걸러내어 당일 거래나 변동성이 큰 시장에서 중요한 도구가 됩니다.
ZLEMA 사용 팁
- 기간 조정: 거래 스타일과 시장 변동성에 따라 ZLEMA 기간을 조정하세요. 단기 거래에는 짧은 기간(예: 10 또는 14)을 사용하고, 장기 추세 추적에는 더 긴 기간(예: 50 또는 100)이 더 적합할 수 있습니다.
- 다른 도구와 결합: ZLEMA는 우수한 추세 추종 기능을 제공하지만, 과매수/과매도 상태를 위한 RSI나 추세 강도를 위한 MACD와 결합하면 정확도를 높일 수 있습니다.
- 테스트 및 최적화: ZLEMA의 성능은 시장 상황에 따라 다를 수 있습니다. 실거래에 사용하기 전에 충분히 백테스트하고 최적화하여 전략에서 최상의 결과를 보장하는 것이 권장됩니다.
요약
AI 요약
The Zero Lag Exponential Moving Average (ZLEMA) is an advanced technical indicator designed to improve upon the traditional Exponential Moving Average (EMA) by reducing lag. It achieves faster response times to price changes while maintaining the smoothing effect of EMA, making it suitable for capturing quick market shifts and trends, especially in volatile or fast-moving markets.
Key features include:
- Zero lag response for timely reaction to price fluctuations.
- Smoothness that filters out noise without sacrificing responsiveness.
- Flexibility to use various price data inputs such as Close, Open, or High prices.
- Utility in trend following and confirming reversal signals.
ZLEMA is particularly useful for short-term traders seeking to capture rapid trend reversals or breakouts, as well as for longer-term trend tracking with enhanced sensitivity compared to EMA. It can be combined with other indicators like RSI or MACD to improve signal accuracy and confirm price breakouts or reversals.
Users can adjust the indicator’s period to match their trading style and market conditions, optimizing performance through backtesting. ZLEMA helps reduce noise and lag, making it a valuable tool for intraday and volatile market trading.
지표 프로필
고객 리뷰
0.0
리뷰: 0
고객 리뷰
이 상품에 대한 리뷰가 아직 없습니다. 이미 사용해 보셨나요? 다른 사람들에게 가장 먼저 소개해 주세요!
상담
자주 묻는 질문(FAQ)
트레이딩 봇, 지표, 플러그인 등 cTrader Store에서 제공되는 상품은 제3자 개발자에 의해 제공되며, 이는 단순히 정보 및 기술적 접근을 목적으로 제공된 것입니다. cTrader Store는 중개인이 아니며, 투자 조언, 개인별 추천 또는 향후 성과에 대한 어떠한 보장도 제공하지 않습니다.


가격
가입일 14/07/2025
259
무료 설치