

설명
무엇을 보는가
이것은 심지나 종가에서 그려지지 않습니다. 각 바마다 롤링 5바 윈도우를 사용하여 실제 거래량 프로필을 작성하고, 가격 범위를 200개의 구간으로 나누며, 가장 많은 거래량이 실제로 거래된 위치를 찾아 그 수준에서 작업합니다. 그런 다음 두 가지 되돌아보기 속도를 사용하여 스윙 고점과 저점을 스캔합니다: 최근 피벗을 위한 빠른 속도와 더 확립된 피벗을 위한 느리고 넓은 속도입니다.
읽는 방법
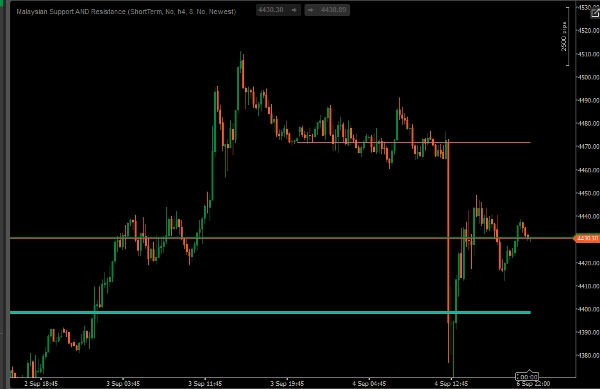
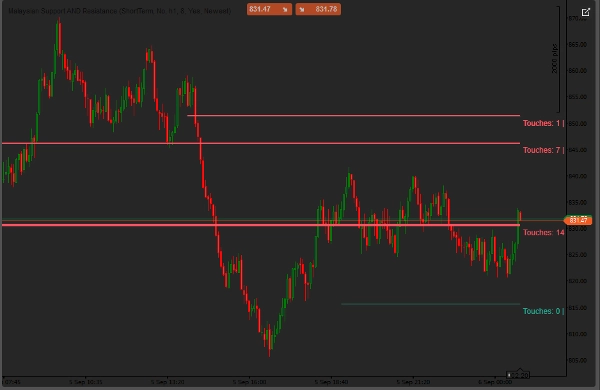
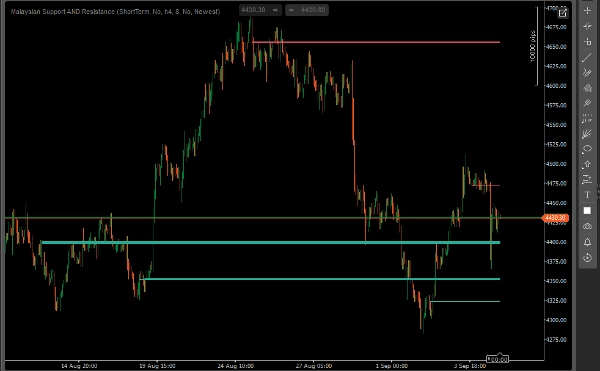
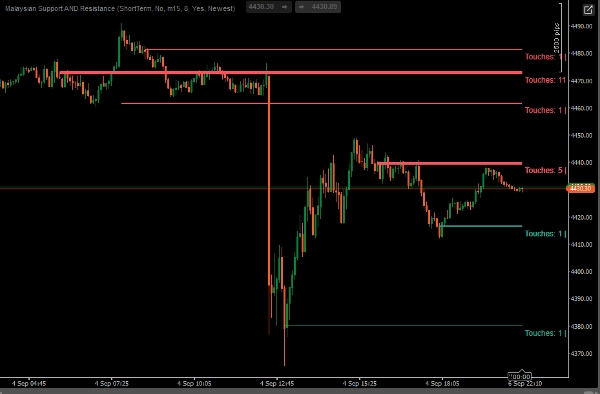
각 선은 지지선 또는 저항선입니다. 색상은 현재 가격이 그 위에 있는지(지지선) 또는 아래에 있는지(저항선)를 보여줍니다. 두께는 그 중요도를 나타내며 — 가격이 몇 번 접촉했는지와 그 근처에서 거래된 거래량을 나타냅니다. "터치 | 거래량 수 표시"를 켜고 선 위에 마우스를 올리면 정확한 숫자를 볼 수 있습니다. 한 번에 최대 8개의 레벨을 볼 수 있습니다: 가장 최근에 형성된 빠른 고점/저점과 3개의 더 확립된 고점 및 3개의 더 확립된 저점입니다.
주요 설정
- 시장 보기 — 단기 / 표준 / 장기, 피벗을 찾기 위해 얼마나 과거를 보는지 제어
- 차트 시간 프레임 또는 특정 상위 시간 프레임 사용
- 표시할 선의 수 — 1에서 8까지
- 레벨 선택 기준 — 최신(가장 최근 3개) 또는 가장 강한(접촉 횟수/거래량이 가장 많은 3개, 나이와 상관없이)
- 터치 | 거래량 수 표시 — 각 선에 숫자를 추가
- 지지선/저항선 색상 — 완전 사용자 지정 가능
대상 사용자
가격 움직임, SMC 또는 ICT 스타일 개념을 다루는 트레이더로서 수동으로 그리는 대신 객관적인 지지선/저항선을 원하는 분들. 자신의 구조와 유동성 판독과 함께 컨플루언스 레이어로 사용할 때 가장 효과적이며, 단독 신호로 사용하기에는 적합하지 않습니다.
알아두면 좋은 점
- 레벨은 충분한 바가 지나서야 확인됩니다 — 최근 가격은 이미 확인된 레벨을 움직이지 않습니다
- 거래량은 틱 거래량이며, 외환/CFD/합성 상품에 표준이며, 거래소 거래량이 아닙니다
- 작동할 수 있는 충분한 이력을 제공하세요. 새로 상장되었거나 조용한 상품에서는 처음에 8개 미만의 레벨이 표시될 수 있으며, 더 많은 피벗이 확인됨에 따라 채워집니다
요약
AI summary
Malaysian Support AND Resistance is a trading indicator that identifies key support and resistance levels using a rolling volume profile. It analyzes every bar by constructing a volume profile over a rolling 5-bar window, dividing the price range into 200 buckets to locate price levels with the highest traded volume. The indicator detects swing highs and lows with two lookback speeds—fast for recent pivots and slower for more established levels.
Displayed lines represent support or resistance, with color indicating whether the current price is above (support) or below (resistance) the level. Line thickness reflects importance based on the frequency of price touches and volume traded near the level. Users can view up to eight levels simultaneously, including the newest fast-forming pivots and multiple established highs and lows. Additional features include customizable settings for market view (short to long term), timeframe selection, number of lines shown, level selection criteria (newest or strongest), and display of touch and volume counts.
This indicator is designed for traders employing price action, Smart Money Concepts (SMC), or ICT-style methods who prefer objective support and resistance levels derived from volume data rather than manual drawing. It functions best as a complementary tool alongside other structural and liquidity analyses. The volume data used is tick volume, standard for forex, CFDs, and synthetic instruments.
Displayed lines represent support or resistance, with color indicating whether the current price is above (support) or below (resistance) the level. Line thickness reflects importance based on the frequency of price touches and volume traded near the level. Users can view up to eight levels simultaneously, including the newest fast-forming pivots and multiple established highs and lows. Additional features include customizable settings for market view (short to long term), timeframe selection, number of lines shown, level selection criteria (newest or strongest), and display of touch and volume counts.
This indicator is designed for traders employing price action, Smart Money Concepts (SMC), or ICT-style methods who prefer objective support and resistance levels derived from volume data rather than manual drawing. It functions best as a complementary tool alongside other structural and liquidity analyses. The volume data used is tick volume, standard for forex, CFDs, and synthetic instruments.
지표 프로필
지표 카테고리
지지 및 저항
출력 유형
시각화
데이터 요구 사항
거래량
틱 데이터
지원되는 신호
레벨 터치
고객 리뷰
0.0
리뷰: 0
고객 리뷰
이 상품에 대한 리뷰가 아직 없습니다. 이미 사용해 보셨나요? 다른 사람들에게 가장 먼저 소개해 주세요!
상담
자주 묻는 질문(FAQ)
Key Levels
Volume
Market Structure
Support & Resistance
트레이딩 봇, 지표, 플러그인 등 cTrader Store에서 제공되는 상품은 제3자 개발자에 의해 제공되며, 이는 단순히 정보 및 기술적 접근을 목적으로 제공된 것입니다. cTrader Store는 중개인이 아니며, 투자 조언, 개인별 추천 또는 향후 성과에 대한 어떠한 보장도 제공하지 않습니다.
이 작성자의 상품 더 보기






!["Gaussian Channel [Iridio Capital]" 로고](https://cdn.ctrader.com/image/webp/2c4f9ca9-4e9b-476d-b5a6-787c8095032b_61546)











가격
1
판매