
설명
이 지표는 매 거래일의 첫 4시간 캔들을 분석하여 일일 가격 범위를 설정합니다. 이전 4시간 캔들의 고가, 저가, 종가를 식별하며 — 이는 기관 투자자와 알고리즘이 각 세션 시작 시 많이 참조하는 세 가지 주요 수준입니다. 또한 15분 스윙 구조를 분석하여 현재 시장 편향을 판단합니다. 이 지표는 모든 시장, 특히 지수에 사용할 수 있습니다.
신호 및 시각적 요소 해석 방법
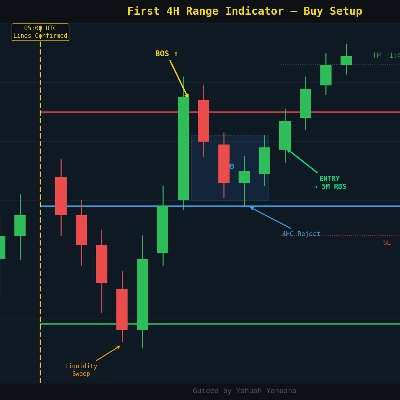
- 빨간색 수평선 — 첫 4시간 캔들의 고가입니다. 일일 범위의 상한선이자 잠재적 저항 수준으로 작용합니다
- 초록색 수평선 — 첫 4시간 캔들의 저가입니다. 하한선이자 잠재적 지지선으로 작용합니다
- 파란색 수평선 (4HC) — 이전 4시간 캔들의 종가로, 새 거래일 시작 시 가격 위치를 표시합니다. 종종 중간 범위 유동성 수준으로 작용합니다
- 금색 수직선 — 모든 수준이 확인된 정확한 바를 표시하여 범위가 설정된 시점을 쉽게 확인할 수 있습니다
- 15분 구조 패널 — 최근 스윙 고점과 저점을 기반으로 강세, 약세 또는 횡보 편향을 표시하며, 차트에 HH/HL/LH/LL 레이블이 표시됩니다
모든 선은 첫 4시간 캔들이 닫히는 순간 고정되어 나타납니다. 확인 후에는 다시 그려지거나 이동하지 않습니다.
주요 설정 및 매개변수
- 최대 기록 일수 — 표시할 과거 일수 수준을 제어합니다
- 일 시작 시 4시간 종가 표시 — 파란색 4HC 선을 켜거나 끕니다
- 일 시작 금색 선 표시 — 금색 수직선을 켜거나 끕니다
- 수직 표시기 표시 — 범위 경계에 제한된 틱 표시를 시각적 참조용으로 표시합니다
- 15분 구조 편향 — 스윙 레이블과 편향 패널을 토글합니다 (5분 차트 전용)
- 스윙 되돌아보기 / 스윙 개수 — 구조 감지 민감도를 제어합니다
- 모든 요소에 대해 완전한 색상, 두께 및 선 스타일 사용자 지정 가능
일반적인 사용 사례 및 거래 시나리오
- H와 L을 일일 범위로 사용하여 킬존(런던/뉴욕 오픈) 동안 반전 또는 돌파를 찾기
- 4HC 수준을 중간 범위 목표 또는 합류 진입 수준으로 사용하기
- SMC, ICT 또는 CRT 프레임워크와 범위를 결합하여 높은 확률의 설정 만들기
- 5분 진입 전에 15분 편향 패널을 확인하여 구조적 정렬 보장
이 지표가 가장 적합한 대상
일일 개장 범위를 구조적 참조로 사용하는 중급에서 고급 인트라데이 트레이더. 특히 스마트 머니 컨셉(SMC), ICT 또는 유사한 방법론을 사용하는 트레이더에게 적합합니다. 모든 타임프레임에서 작동하지만 5분 또는 1분 차트와 함께 사용할 때 진입 정밀도가 가장 높습니다.
중요한 제한 사항 및 사용 주의
- 수준은 당일 첫 4시간 캔들이 닫힌 후에만 나타납니다 — 해당 캔들이 형성 중일 때는 수준이 표시되지 않습니다
- 수준이 나타나는 정확한 시간은 브로커의 4시간 캔들 정렬에 따라 다릅니다. Deriv에서는 첫 4시간 캔들이 UTC 01:00에 열리고 UTC 05:00에 닫힙니다
- 15분 구조 편향 패널은 5분 차트에만 제한됩니다
- 최적의 스크롤 성능을 위해 금색 수직선을 비활성화하거나 지연이 발생할 경우 최대 기록 일수를 줄이십시오
요약
AI summary
This indicator analyzes the first 4-hour candle of each trading day to define a daily price range by marking its high, low, and close levels. These levels serve as key reference points commonly used by institutional traders and algorithms at the start of each session. The indicator also evaluates 15-minute swing structure to determine current market bias, displaying Bullish, Bearish, or Ranging conditions with labeled swing highs and lows. Visual elements include a red line for the 4H candle high (potential resistance), green line for the low (potential support), blue line for the previous 4H candle close (mid-range liquidity), and a gold vertical line marking when these levels are confirmed. All lines are fixed once the first 4H candle closes, with no repainting. Customizable settings allow control over history length, visibility of lines and markers, and swing detection sensitivity. Typical use cases involve identifying daily range breakouts or reversals during key market open times, using the 4H close as a target or confluence level, and combining with Smart Money Concepts or related frameworks for trade entries. The indicator is suited for intermediate to advanced intraday traders, especially those using 5-minute or 1-minute charts for precise entries. It supports any market but is optimized for indices. Levels appear only after the first 4H candle closes, with timing dependent on broker candle alignment.
지표 프로필
지표 카테고리
시장 구조 (SMC)
출력 유형
필터
데이터 요구 사항
막대만
고객 리뷰
0.0
리뷰: 0
고객 리뷰
이 상품에 대한 리뷰가 아직 없습니다. 이미 사용해 보셨나요? 다른 사람들에게 가장 먼저 소개해 주세요!
상담
자주 묻는 질문(FAQ)
Key Levels
BOS
Liquidity Grab
트레이딩 봇, 지표, 플러그인 등 cTrader Store에서 제공되는 상품은 제3자 개발자에 의해 제공되며, 이는 단순히 정보 및 기술적 접근을 목적으로 제공된 것입니다. cTrader Store는 중개인이 아니며, 투자 조언, 개인별 추천 또는 향후 성과에 대한 어떠한 보장도 제공하지 않습니다.
이 작성자의 상품 더 보기














!["[Hamster-Coder] Pivot Points MTF" 로고](https://cdn.ctrader.com/image/webp/4c143e5a-309c-40e3-a578-f04d1e133ffa_31159)




가격
1
판매