
WaveWeisBarForce
Indikator
174 unduhan
Versi 1.0, Dec 2025
Windows, Mac
5.0
Ulasan: 2
Deskripsi
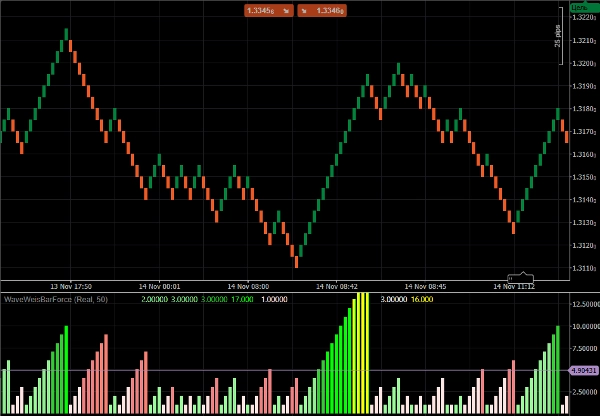
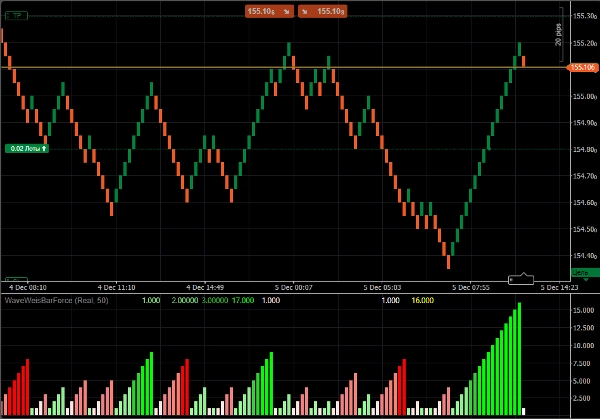
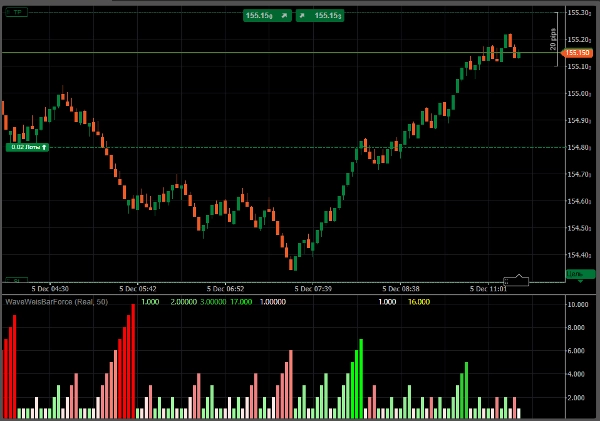
Wave Weis Bar Force - adalah indikator yang menerapkan logika gelombang Volume (Weis) untuk menentukan akumulasi dan perubahan arah pasar.
Ini merangkum volume selama tren tetap tidak berubah. Ketika arah berubah, gelombang baru dimulai dan akumulasi direset.
Intensitas dihitung berdasarkan level, sesuai dengan perbandingan antara volume gelombang saat ini dan akumulasi terbesar baru-baru ini. Ini berfungsi sebagai filter tambahan dan menunjukkan hasil yang baik pada strategi tren.
Ringkasan
Ringkasan AI
Wave Weis Bar Force is a technical indicator that applies the concept of Volume Waves (Weis) to identify market accumulation phases and detect changes in market direction. It aggregates volume data while the current trend persists, resetting accumulation when a new wave begins with a trend reversal. The indicator calculates intensity levels based on the ratio of the current wave's volume to the largest recent accumulation, providing a quantitative measure of volume strength. This functionality serves as an additional filter and is particularly useful in trending market strategies. The indicator supports analysis across multiple markets including Forex, Crypto, and Stocks, and is applicable to trading approaches such as breakout and scalping strategies.
Profil indikator
Ulasan pelanggan
5.0
Ulasan: 2
5 | 100 % | |
4 | 0 % | |
3 | 0 % | |
2 | 0 % | |
1 | 0 % |
Ulasan pelanggan
December 10, 2025
WaveWeisBarForce blends Weis Wave logic with bar-strength analysis to show real buying/selling force. Clean histogram, stable performance, great for confirming impulses and spotting exhaustion. Useful for Wyckoff, VSA and intraday momentum traders.
Diskusi
Pertanyaan umum
Forex
Breakout
Scalping
Crypto
Stocks
Produk-produk yang tersedia melalui cTrader Store, termasuk bot trading, indikator, dan plugin, disediakan oleh pengembang pihak ketiga serta hanya ditujukan untuk akses teknis dan informasi. cTrader Store bukan broker dan tidak menyediakan saran investasi, rekomendasi pribadi, atau jaminan apa pun tentang kinerja di masa mendatang.
Produk lain dari penulis ini


Anda mungkin juga suka


![Logo "[Hamster-Coder] Bollinger Bands"](https://cdn.ctrader.com/image/webp/21d8e5d6-fb11-4bac-b9ee-cd05c2b76804_30327)
Harga
Sejak 24/10/2025
1.43M
Volume trading
4.79K
Pip dimenangkan
2
Penjualan
332
Instal gratis