

Money Flow Profile
Indicateur
Version 1.0, Jul 2026
Windows, Mac

534.4M
Volume tradé
9.76M
Pips gagnés
4
Ventes
Description
📊 Profil du Flux Monétaire
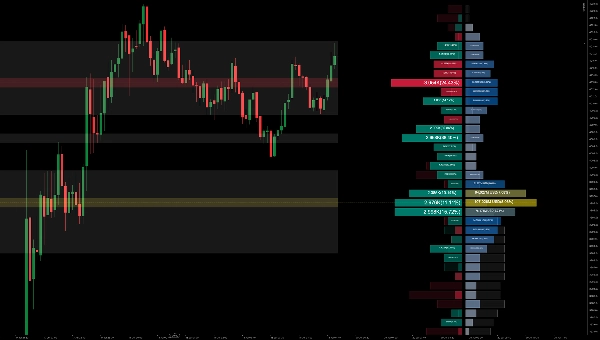
Le Profil du Flux Monétaire est un outil de graphique avancé qui mesure le volume échangé ou le flux monétaire à tous les niveaux de prix sur le marché sur une période de temps spécifiée. Il met en évidence la relation entre le prix de l'actif et la volonté des traders d'acheter ou de vendre, vous permettant de :
- Révéler les Niveaux de Prix Clés : Identifier facilement les grappes de volume et les nœuds de haute liquidité comme le Point de Contrôle (POC).
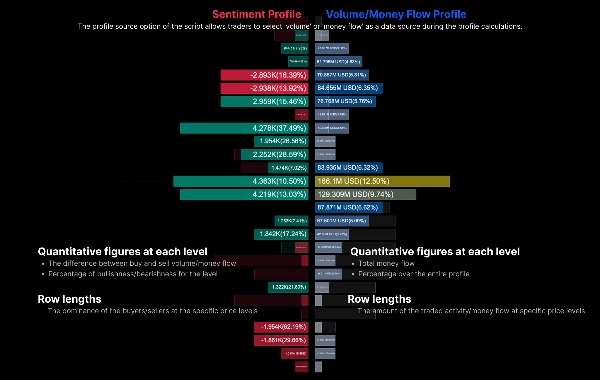
- Analyser le Sentiment du Marché : En affichant un Profil de Sentiment à gauche et un Profil de Volume à droite, il détermine si les acheteurs ou les vendeurs dominent à chaque niveau de prix spécifique.
- Comparaison Inter-Périodes : Comparez directement le profil actuel avec le profil fantôme de la période précédente pour observer les déplacements du centre de gravité du marché.
⚙️ Paramètres Principaux & Guide d'Utilisation
1. Paramètres Généraux
- Longueur de Rétroaction / Plage Fixe : Définit le nombre de barres historiques utilisées pour calculer le profil (par exemple, les 200 dernières barres).
- Source des Données :
-
1 = Volume: Calcule le profil basé sur le volume traditionnel des ticks/transactions.2 = Flux Monétaire: Intègre la profondeur des prix pour calculer la distribution du flux monétaire.
2. Paramètres du Profil
- Résolution des Rangées (Rangées) : Détermine la granularité de l'axe vertical. Un nombre plus élevé (par exemple, 50-100) donne un profil plus détaillé.
- Largeur du Profil & Décalage Horizontal : Ajuste la largeur du profil dessiné (en pourcentage) et le décalage vers la droite, évitant qu'il ne chevauche la bougie actuelle.
3. Sentiment & Affichage
- Polarité du Sentiment :
-
1 = Bougie: Détermine le sentiment haussier/baissier basé uniquement sur l'ouverture et la fermeture de la bougie (polarité).2 = Pression Achat/Vente: Utilise un calcul plus précis prenant en compte les mèches et la clôture relative au plus haut/bas.
- Afficher le Profil de Sentiment / Profil de Volume : Bascule indépendants pour afficher le profil net de sentiment (gauche) et le profil principal de volume (droite).
- Afficher la Période Précédente : Lorsqu'activé, il dessine un profil "Barre Fantôme" en arrière-plan représentant exactement la même fenêtre temporelle de la période précédente. Idéal pour suivre les déplacements de support/résistance.
4. Affichage de la Zone Étendue
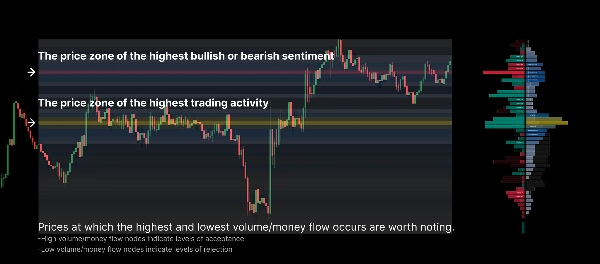
- Afficher la Carte Thermique : Projette la densité du profil sur toute la période de calcul en tant que carte thermique de fond. Vous pouvez choisir de projeter soit le "Volume" soit le "Sentiment".
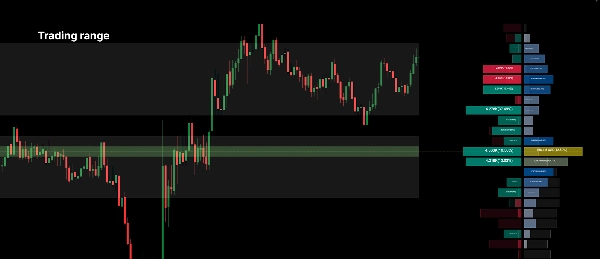
- Afficher la Zone de Valeur : Met en évidence la plage de prix principale où la majorité du volume de trading a eu lieu. Le seuil est personnalisable (par exemple, 70%).
- Afficher la Zone POC : Trace automatiquement une ligne horizontale et une zone au Point de Contrôle (le niveau de prix avec le volume le plus élevé) pour la plage sélectionnée.
💡 Conseils Pratiques de Trading :
- Recherchez les Nœuds de Volume Élevé (Pics) pour agir comme des niveaux solides de support ou de résistance.
- Recherchez les Nœuds de Volume Faible (Vallées), car le prix a tendance à se déplacer rapidement à travers ces zones de faible liquidité.
- Utilisez le Profil Fantôme de la Période Précédente : Si le POC actuel (ligne jaune) se forme plus haut que le POC de la période précédente, cela indique que le consensus de valeur se déplace vers le haut, ce qui est généralement un signal haussier.
Résumé
AI summary
Money Flow Profile is an advanced indicator that maps traded volume and market sentiment across price levels over a specified time period. It visualizes the relationship between price and trader activity, highlighting key liquidity zones such as volume clusters and the Point of Control (POC). The tool displays a Sentiment Profile on the left and a Volume Profile on the right, enabling users to assess whether buyers or sellers dominate at each price level. It supports direct comparison with the previous period’s profile via a ghost overlay to track shifts in market value consensus.
Core configurable parameters include lookback length, data source selection (volume or money flow), row resolution for vertical granularity, profile width and offset, and sentiment polarity calculation methods (candle-based or buy/sell pressure). Display options allow toggling of sentiment and volume profiles, previous period overlays, heatmaps of volume or sentiment density, value area highlighting, and automatic POC zone marking.
The indicator is designed to help identify strong support and resistance levels at high volume nodes and anticipate rapid price movements through low volume nodes. It supports detailed volume and sentiment analysis to inform trading decisions based on liquidity and market structure.
Core configurable parameters include lookback length, data source selection (volume or money flow), row resolution for vertical granularity, profile width and offset, and sentiment polarity calculation methods (candle-based or buy/sell pressure). Display options allow toggling of sentiment and volume profiles, previous period overlays, heatmaps of volume or sentiment density, value area highlighting, and automatic POC zone marking.
The indicator is designed to help identify strong support and resistance levels at high volume nodes and anticipate rapid price movements through low volume nodes. It supports detailed volume and sentiment analysis to inform trading decisions based on liquidity and market structure.
Profil de l'indicateur
Catégorie de l'indicateur
Volume
Type de résultat
Visualisation
Exigences en matière de données
Volume
DoM
Barres seulement
Données de tick
Signaux pris en charge
Cassure
Puissance de la tendance
Inversion
Volatilité
Atteinte du niveau
Dépassement de niveau
Avis clients
0.0
Avis : 0
Avis clients
Il n'y a pas encore d'avis sur ce produit. Vous l'avez déjà essayé ? Soyez le premier à en parler aux autres !
Discussion
Questions fréquentes
Key Levels
Volume
Les produits disponibles sur cTrader Store, notamment les bots de trading, les indicateurs et les plug-ins, sont fournis par des développeurs tiers et mis à disposition à titre informatif et à des fins d'accès technique uniquement. cTrader Store n'est pas un courtier et ne fournit aucun conseil en investissement, aucune recommandation personnelle ni aucune garantie quant aux performances futures.
Plus de cet auteur





















Prix
534.4M
Volume tradé
9.76M
Pips gagnés
4
Ventes