
Beschreibung
Pinescritlabs
Ctrader Store Indikatoren: 🤖Pinescritlabs Ctrader Store cBots:
Fair Value Gap Sessions Gold & BTC Breakout Session Pivots(neu)
Dynamische Marktstruktur
Analyse von Wendepunkten
Fibonacci Linear
Regression Multi-Zeitrahmen
Multi-Level Kerzen-Bias
Tracker
Reaktive Gleitender Durchschnitt
Auto Support und
Resistance Trend Lines
Alle Support und
Resistance Levels
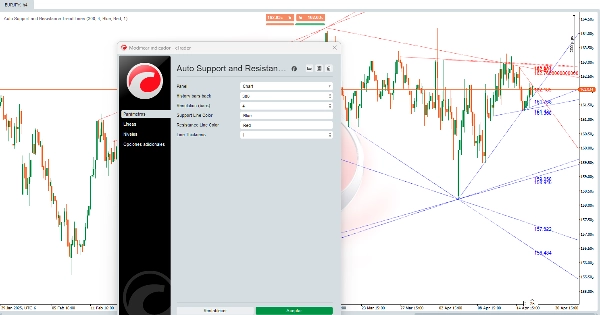
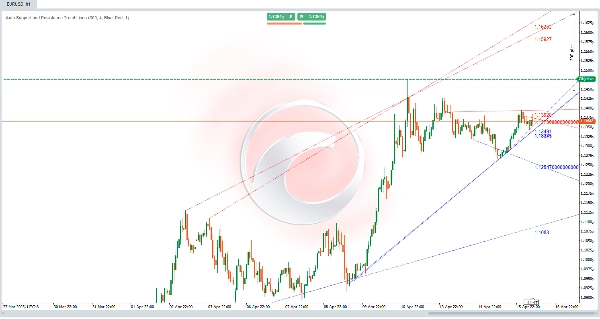
Auto Support und Resistance Trend Lines:
Dieser Algorithmus ist ein leistungsstarkes Werkzeug 🛠️, das entwickelt wurde, um automatisch Unterstützungs- und Widerstandsniveaus auf einem Preischart zu identifizieren. Er zeichnet nicht nur horizontale Linien, sondern verfolgt auch diagonale Kanäle ↗️↘️, die Markttrends darstellen. Diese Niveaus und Kanäle sind Schlüsselbereiche, in denen der Preis Schwierigkeiten hatte, höher (Widerstand 🚧) oder niedriger (Unterstützung 🛡️) zu steigen, was sie zu entscheidenden Punkten für Handelsentscheidungen macht. 📈📉
Wie werden die Berechnungen durchgeführt? 🔍
Der Algorithmus verwendet einen Analyseansatz der Preisgeschichte 📊, um Unterstützungs- und Widerstandsniveaus zu identifizieren. So funktioniert es:
- Identifikation lokaler Tiefs und Hochs ⬇️⬆️
-
- Der Algorithmus analysiert den Preis über einen bestimmten Bereich von Bars (Kerzen), um lokale Tiefs (die niedrigsten Preise in diesem Bereich) und lokale Hochs (die höchsten Preise in diesem Bereich) zu finden.
- Diese lokalen Tiefs und Hochs sind potenzielle Kandidaten , um Unterstützungs- und Widerstandsniveaus zu werden.
- Validierung der Niveaus ✔️
-
- Sobald lokale Tiefs und Hochs identifiziert sind, überprüft der Algorithmus, ob diese Niveaus in der Vergangenheit vom Preis respektiert wurden.
- Wenn der Preis ein Niveau mehrfach berührt hat, ohne es klar zu durchbrechen, gilt es als gültiges Unterstützungs- oder Widerstandsniveau.
- Zeichnen von Linien und Kanälen ✏️
-
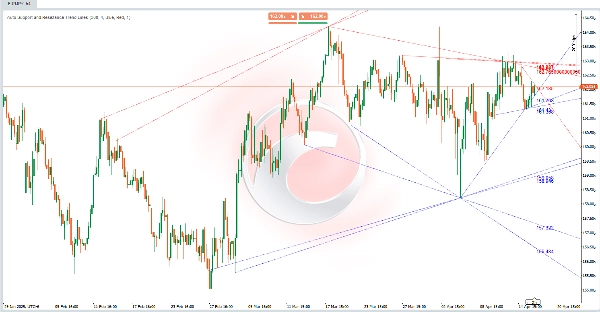
- Unterstützungsniveaus werden als horizontale (oder diagonale) Linien an validierten lokalen Tiefs gezeichnet.
- Widerstandsniveaus werden als horizontale (oder diagonale) Linien an validierten lokalen Hochs gezeichnet.
- Zusätzlich verbindet der Algorithmus diese Niveaus, um diagonale Kanäle ↗️↘️ zu bilden, die bullische oder bärische Trends im Markt darstellen.
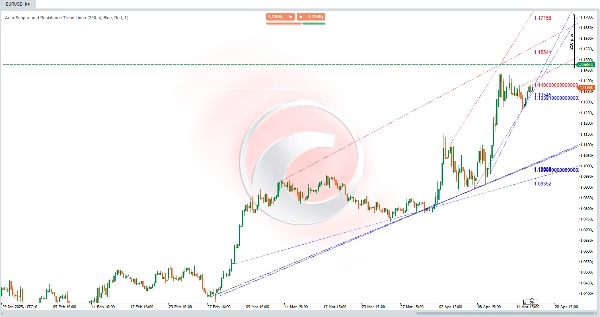
- Dynamische Aktualisierungen 🔄
-
- Der Indikator aktualisiert sich automatisch mit jeder neuen Kerze und berechnet und zeichnet Unterstützungs- und Widerstandsniveaus basierend auf dem aktuellsten Preisverhalten neu.
Wie hilft dieser Algorithmus Händlern? 💡
Dieser Algorithmus ist ein Game-Changer für Händler, weil:
- Bietet eine makroökonomische Sicht auf den Markt 🌐
-
- Indem er diagonale Kanälezeichnet, zeigt der Algorithmus die wichtigsten Markttrends, was Händlern hilft zu erkennen, ob der Preis sich in einem Aufwärtstrend 📈, Abwärtstrend 📉 oder einer Seitwärtsbewegung ↔️ befindet.
- Identifiziert wichtige Unterstützungs- und Widerstandsbereiche 🎯
-
- Unterstützungs- und Widerstandsniveaus sind Zonen, in denen der Preis möglicherweise abprallt oder durchbricht. Diese Niveaus sind nützlich für:
-
- Festlegung von Ein- und Ausstiegspunkten für Trades.
- Setzen von Stop-Loss 🛑 und Take-Profit ✅ Aufträgen.
- Erkennung von Ausbrüchen 🚀 oder Umkehrungen 🔄 im Preis.
- Vereinfacht die technische Analyse 🕒
-
- Der Algorithmus automatisiert den Prozess der Identifizierung von Unterstützung und Widerstand, was Zeit für Händler spart, die manuelle Analysen durchführen.
- Durch die klare Darstellung von Niveaus und Kanälen hilft er Händlern, informiertere Entscheidungenzu treffen.
- Anpassbar 🎨
-
- Händler können Parameter wie die Anzahl der analysierten historischen Bars, Linienstärkeund Farbenanpassen, wodurch der Indikator auf verschiedene Handelsstile und visuelle Vorlieben zugeschnitten werden kann.
Praktisches Beispiel 📌
Stellen Sie sich vor, Sie analysieren einen Preischart, und der Algorithmus hat gezeichnet:
- Eine diagonale Unterstützungslinie ↗️, die mehrere lokale Tiefs verbindet und einen Aufwärtstrendanzeigt.
- Eine diagonale Widerstandslinie ↗️, die mehrere lokale Hochs verbindet und einen aufsteigenden Kanalzeigt.
- Mehrere horizontale Linien, die wichtige Unterstützungs- und Widerstandsniveausdarstellen.
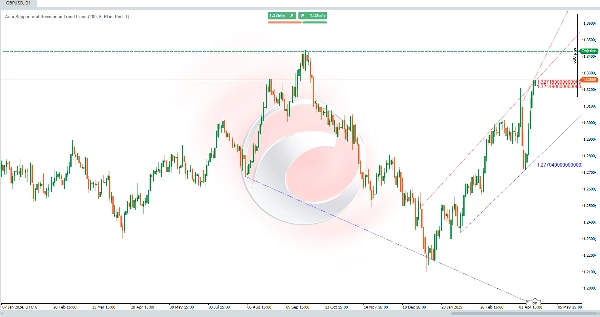
Mit diesen Informationen können Sie:
- Erkennen, dass sich der Preis in einem Aufwärtstrend 📈 befindet.
- Nach Kaufgelegenheitenin der Nähe der diagonalen Unterstützungslinie oder horizontalen Unterstützungsniveaus suchen.
- Einen Stop-Loss 🛑 unterhalb des nächstgelegenen Unterstützungsniveaus setzen.
- Beobachten, ob der Preis den Widerstand durchbricht, um eine Fortsetzung des Trends oder eine mögliche Umkehr 🔄 zu bestätigen.
Zusammenfassung
Once validated, support and resistance levels are drawn as horizontal or diagonal lines, and connected to form channels indicating bullish or bearish trends. The indicator updates dynamically with each new bar, recalculating and redrawing levels to reflect the most recent price behavior.
This tool aids traders by providing a macro view of market trends, identifying zones where price may bounce or break, and simplifying technical analysis through automation. It supports setting entry and exit points, stop-loss and take-profit orders, and spotting potential breakouts or reversals. Parameters such as the number of historical bars analyzed, line thickness, and colors can be customized to fit different trading styles and preferences.


