present
Registrieren Sie sich und erhalten Sie $50 Rabatt auf Ihren ersten Kauf
Trading product for SC Market Structure Indikator Market Structure, image 1
SC Market Structure
Indikator
135 downloads
Version 1.3, Jun 2026
Windows, Mac
5.0
Bewertungen: 1
Trading product for SC Market Structure Indikator Market Structure, image 2
Trading product for SC Market Structure Indikator Market Structure, image 3
Trading product for SC Market Structure Indikator Market Structure, image 4
Seit 04/01/2026
442
Kostenlose Installationen

Beschreibung

SC Market Structure

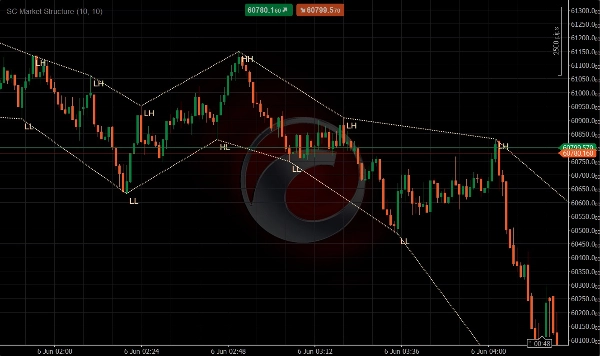
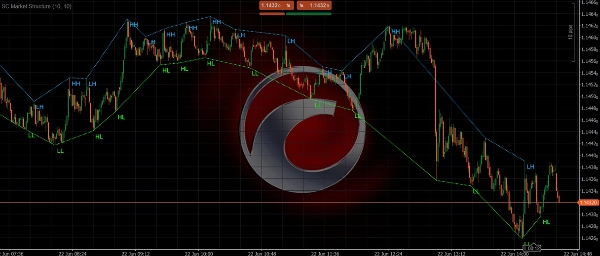
SC Market Structure ist ein visueller Marktstruktur-Indikator, der entwickelt wurde, um automatisch die wichtigsten Swing-Hochs und Swing-Tiefs direkt im Chart zu identifizieren und anzuzeigen.

Der Indikator analysiert kontinuierlich die Kursbewegungen und bildet die Entwicklung der Marktstruktur ab, indem er bedeutende Hochs und Tiefs mit dynamischen Struktur-Linien verbindet. Dies ermöglicht es Tradern, die Trendrichtung, Trendfortsetzung und potenzielle Umkehrpunkte sofort zu erkennen, ohne die Marktschwünge manuell markieren zu müssen.

Darüber hinaus klassifiziert SC Market Structure automatisch jeden neuen Strukturpunkt anhand der standardmäßigen Marktstruktur-Definitionen:

  • HH (Higher High)
  • HL (Higher Low)
  • LH (Lower High)
  • LL (Lower Low)

Durch die Kombination der automatischen Swing-Erkennung mit der Echtzeit-Markstruktur-Kennzeichnung können Trader schnell verstehen, ob sich der Markt in einem Trend befindet, konsolidiert oder Anzeichen einer möglichen Trendwende zeigt.

Hauptmerkmale

• Automatische Erkennung signifikanter Swing-Hochs und Swing-Tiefs
• Dynamische Struktur-Linien, die Markt-Pivots verbinden
• Automatische Identifikation von Higher Highs (HH)
• Automatische Identifikation von Higher Lows (HL)
• Automatische Identifikation von Lower Highs (LH)
• Automatische Identifikation von Lower Lows (LL)
• Klare Visualisierung der bullischen und bärischen Marktstruktur
• Sofortige Erkennung von Trendfortsetzungs- und Umkehrmustern
• Funktioniert auf allen Märkten und Zeitrahmen
• Saubere und intuitive Chart-Darstellung

Marktstruktur-Visualisierung

SC Market Structure bewertet kontinuierlich Kurs-Schwünge und kennzeichnet jeden neu bestätigten Strukturpunkt.

Bullische Struktur

Eine bullische Marktstruktur wird identifiziert, wenn der Kurs folgende Punkte bildet:

• Higher Highs (HH)
• Higher Lows (HL)

Diese Abfolge zeigt an, dass die Käufer die Kontrolle behalten und der Aufwärtstrend weiterhin intakt ist.

Bärische Struktur

Eine bärische Marktstruktur wird identifiziert, wenn der Kurs folgende Punkte bildet:

• Lower Highs (LH)
• Lower Lows (LL)

Diese Abfolge zeigt an, dass die Verkäufer die Kontrolle behalten und der Abwärtstrend weiterhin intakt ist.

Der Indikator verbindet diese Strukturpunkte visuell mit dynamischen Trendlinien, sodass Trader die Entwicklung der Kursstruktur in Echtzeit verfolgen können.

Warum SC Market Structure verwenden

Das Verständnis der Marktstruktur ist einer der wichtigsten Aspekte des Price Action Tradings.

Viele Trader zeichnen Swing-Hochs, Swing-Tiefs und Trendstrukturen manuell, was zeitaufwändig und subjektiv sein kann.

SC Market Structure automatisiert diesen Prozess, indem es strukturelle Wendepunkte objektiv identifiziert und sie gemäß professionellen Marktstruktur-Prinzipien kennzeichnet.

Dies ermöglicht Tradern:

• Die Trendrichtung schneller zu erkennen
• Potenzielle Umkehrungen früher zu identifizieren
• Trendfortsetzungs-Setups zu bestätigen
• Ein- und Ausstiegszeitpunkte zu verbessern
• Einen saubereren und besser organisierten Chart zu pflegen

Perfekt für

• Price Action Trader
• Scalper
• Day Trader
• Swing Trader
• Trendfolgende Trader
• Marktstruktur-Trader
• Smart Money Concept (SMC) Trader
• Trader, die eine objektive Strukturanalyse suchen

Wichtiger Hinweis

SC Market Structure identifiziert die Marktstruktur basierend auf bestätigten Swing-Hochs und Swing-Tiefs. Labels und Struktur-Linien werden erst generiert, nachdem ein Pivot durch die ausgewählten Berechnungseinstellungen validiert wurde.

Die Anpassung der Sensitivitätseinstellungen beeinflusst, wie häufig neue Strukturpunkte identifiziert und angezeigt werden.

Im Gegensatz zu traditionellen MACD-Indikatoren basiert sein visuelles Konzept darauf, Momentum-Informationen in die Price Action Analyse zu integrieren. Aus diesem Grund wird die Verwendung des Indikators in einem separaten Panel nicht empfohlen und bietet nicht die beabsichtigte Benutzererfahrung.

Lies den Trend. Folge der Struktur. Handle mit Vertrauen.

Zusammenfassung

KI-Zusammenfassung
SC Market Structure is a visual trading indicator that automatically detects and labels key market swings on price charts. It identifies significant swing highs and lows, marking them as Higher Highs (HH), Higher Lows (HL), Lower Highs (LH), and Lower Lows (LL) according to standard market structure definitions. The indicator dynamically connects these points with trend lines, enabling traders to visualize bullish and bearish structures in real time.

By continuously analyzing price action, SC Market Structure helps traders quickly determine trend direction, recognize trend continuation, and spot potential reversal points without manual chart annotations. It supports all markets and timeframes, providing a clean and intuitive chart presentation.

This tool is suited for price action traders, scalpers, day traders, swing traders, trend followers, and those using Smart Money Concepts or seeking objective market structure analysis. Sensitivity settings allow customization of pivot detection frequency. The indicator integrates momentum information into price action analysis and is designed for direct chart overlay rather than separate panels.
Indikatorprofil
Indikatorkategorie
Marktstruktur (SMC)
Ausgabetyp
Visualisierung
Datenanforderungen
Nur Balken
Unterstützte Signale
Wendepunkt
Trendstärke

Kundenbewertungen

5.0
Bewertungen: 1
5
100 %
4
0 %
3
0 %
2
0 %
1
0 %
Kundenbewertungen
July 19, 2026
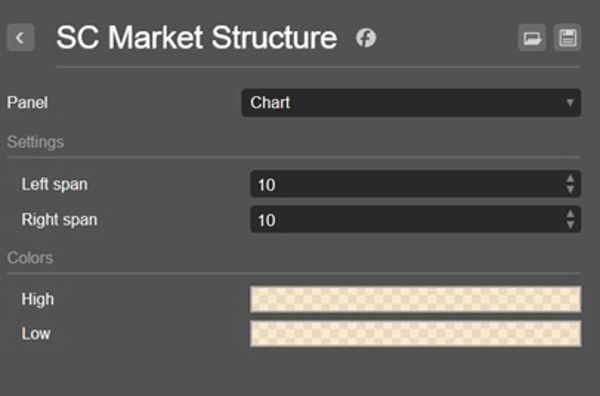
SC MS is an excellent, minimalist tool that automates the tedious process of mapping swing highs and lows. It accurately labels market structure (HH, HL, LH, LL) and connects pivots with clean trend lines, making trend direction and potential reversals instantly recognizable. The adjustable span settings allow customization for any timeframe. While the last unconfirmed swing will naturally repaint until validated, it’s a highly reliable, lightweight overlay for Price Action and SMC traders.

Diskussion

Häufig gestellte Fragen (FAQ)

Market Structure
Über den cTrader Store verfügbare Produkte, einschließlich Handelsbots, Indikatoren und Plugins, werden von externen Entwicklern bereitgestellt und nur zu Informations- und technischen Zugriffszwecken verfügbar gemacht. cTrader Store ist kein Broker und erbringt keine Anlageberatung, persönlichen Empfehlungen oder eine Garantie für zukünftige Performance.

Mehr von diesem Autor

Indikator
ATR
ATR-based trailing stop that adapts to volatility, protects profits, and follows trends automatically.
Indikator
ATR
Key Levels
+2
Professional support & resistance detection with adaptive bands and smart signals.
Indikator
MACD
Dynamic MACD histogram dots with smart crossing signals for faster momentum analysis.
cBot
Key Levels
SL Manager
+5
Adaptive cTrader bot based on Support & Resistance with advanced risk management and smart filtering.
2.87
Gewinnfaktor
Indikator
ADX
Minimalist ADX indicator using dynamic dots for a cleaner and faster trend strength visualization.
Indikator
RSI
Minimalist RSI dots with dynamic colors for instant momentum and extreme zone recognition.

Das könnte Sie auch noch interessieren

Indikator
MACD
Forex
+6
Auto Signal BUY SELL is a professional decision-making tool designed to help you follow the trend and capture high-proba
Indikator
ATR
RSI
+4
RSI bands drawn on price, confluence-scored BUY/SELL signals, an ATR stop with three targets
Indikator
ATR
RSI
+5
Multi-factor VWAP mean-reversion signals with ATR bands, volume exhaustion, and RSI gate on cTrader.
Indikator
ATR
RSI
+14
A metric that can set 1 to 3 groups of Bollinger Bands
Indikator
Key Levels
Market Structure
+1
HTF Candle Projector displays the current Higher Timeframe candle (4H or 1H) as a real projected candle LIVE..
„KANDIKA HEAT MAP“-Logo
Beste Ratings
4.6
(5)
$19
Indikator
Color-Based Market Pressure & Volatility Visualizer The Kandika Heatmap Indicator
Indikator
SMC
Prop
+11
Sessions PRO is a professional session visualization indicator - 4 Fully Customizable Sessions
Indikator
ADX
ATR
+5
Range-filter BUY/SELL flips with an ATR or swing stop, three targets, five confluence stars and a live panel
Indikator
The Renko Moving Average Cross indicator combines classic EMA crossover signals with Renko-filtered prices.
Indikator
Forex
Crypto
+3
Wave Weis Bar Force - is an indicator that applies the logic of Volume waves (Weis) to determine accumulation
Indikator
Laguerre RSI: smoother, faster RSI with less noise. Great for spotting reversals and timing entries.
Indikator
Forex
Crypto
+5
ICT Order Block Advanced
Indikator
ATR
Key Levels
+3
Objective support/resistance zones built from consecutive candle-overlap through same price range, on any base timeframe
Indikator
ATR
RSI
+16
Multi-timeframe trend indicator using EMA, MACD & ADX to confirm high-probability buy and sell bias.
Indikator
Volume
Liquidity Sweep
+1
Liquidity Profiler Tools
Indikator
Forex
Real-Time Candlestick Pattern Detection with Custom Alerts & Trend Analysis for cTrader
Indikator
ATR
Forex
+9
Auto-detect swing highs/lows. Spot reversals, map structure, and filter noise with adjustable strength.
Indikator
ADX
ATR
+5
SuperTrend signals scored on five confluence factors, with an ATR stop, three targets and a dashboard.

Preis

Seit 04/01/2026
442
Kostenlose Installationen