
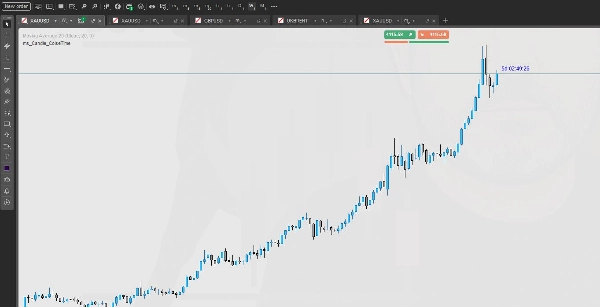
ms_Candle_ColseTime
Indicator
491 downloads
Version 1.0, Oct 2025
Windows, Mac
Description
Price: Free
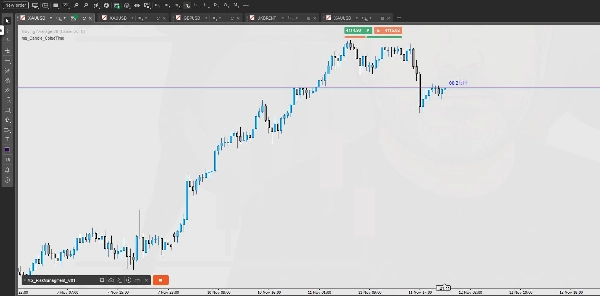
Never lose track of your candle timing again!
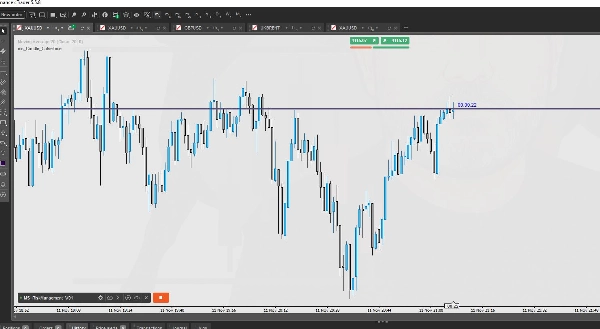
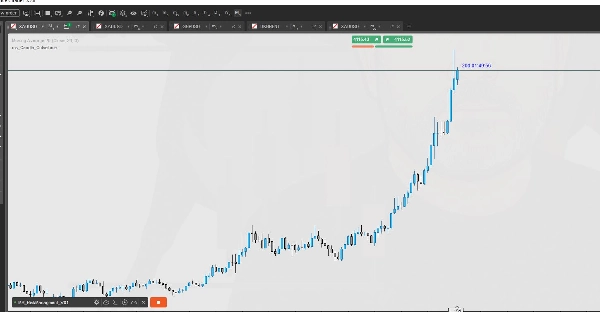
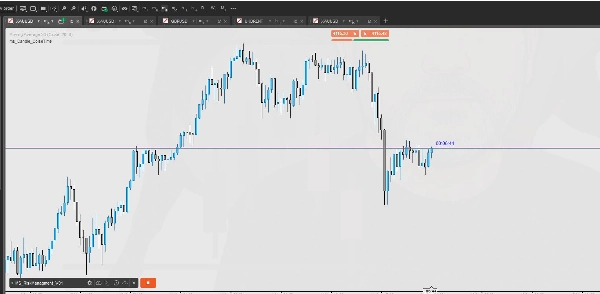
The Candle Time Remaining indicator displays the exact time left until the current candle closes — across all timeframes and any instrument — updating dynamically as the market moves.
💡 Main Features
- Multi-Timeframe Support — Works seamlessly on all timeframes (from 1-minute to 1-month charts).
- Real-Time Countdown — Continuously updates every tick, perfectly synced with the market clock.
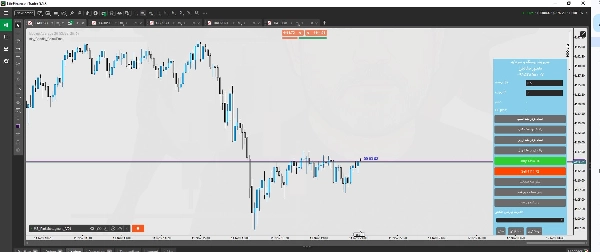
- Floating Display — The timer moves dynamically along with the live market price, staying visible where you need it most.
- Compact & Clear UI — Clean typography and auto-adjusted positioning for maximum readability.
- Customizable Positioning — You can easily choose where to display the countdown (e.g., near price, top-right, bottom-left).
- Lightweight & Fast — Minimal CPU usage; ideal for traders running multiple charts or indicators.
⚙️ How It Works
- The indicator automatically detects your chart’s current timeframe and server time.
- Calculates the exact remaining time until the current candle closes.
- Updates in real time — even when the market is moving tick-by-tick.
🧭 Why Traders Love It
- Perfect for scalpers and intraday traders waiting for candle closures before entries.
- Keeps you aware of timing for breakouts, confirmations, and bar close signals.
- No lag, no refresh delays — pure real-time precision.
⚠️ Compatibility
- Platform: cTrader Desktop
- Works on: All symbols and timeframes
- Recommended Use: Any trading style — Scalping, Day Trading, Swing Trading
How to Use the Candle Remaining Time Indicator
This indicator does not require any special configuration.
Simply attach it to your chart, and it will automatically display the remaining time of the current candle based on the selected timeframe.
It works on all timeframes.
Summary
AI summary
The ms_Candle_ColseTime indicator for cTrader Desktop provides a real-time countdown of the remaining time until the current candle closes on any chart. It automatically detects the chart’s timeframe and server time, then continuously updates the exact time left until candle closure with each market tick. This indicator supports all timeframes, from 1-minute to monthly charts, and works on all trading instruments available on the platform.
Key features include a floating display that moves dynamically with the live market price, customizable positioning options (e.g., near price, top-right, bottom-left), and a compact, clear user interface designed for readability. It is lightweight and optimized for minimal CPU usage, making it suitable for traders running multiple charts or indicators simultaneously.
This tool is particularly useful for scalpers and intraday traders who rely on precise candle close timing for entries, breakouts, confirmations, and bar close signals. It requires no special configuration—simply attach it to a chart to start viewing the countdown. The indicator supports all trading styles including scalping, day trading, and swing trading.
Indicator profile
Customer reviews
0.0
Reviews: 0
Customer reviews
No reviews for this product yet. Already tried it? Be the first to tell others!
Discussion
FAQ
Forex
Products available through cTrader Store, including trading bots, indicators and plugins, are provided by third-party developers and made available for informational and technical access purposes only. cTrader Store is not a broker and does not provide investment advice, personal recommendations or any guarantee of future performance.
More from this author


Price
20.18M
Traded volume
105.55K
Pips won
949
Free installs