present
سجل واحصل على خصم 50 دولارًا على مشترياتك الأولى
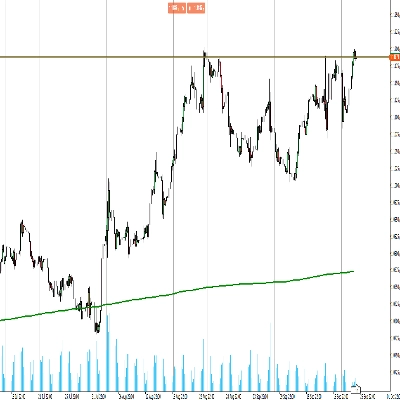
Trading product for MidasVolumeProfile مؤشر Key Levels Volume, image 1
MidasVolumeProfile
مؤشر
الإصدار 1.3، Oct 2026
Windows, Mac
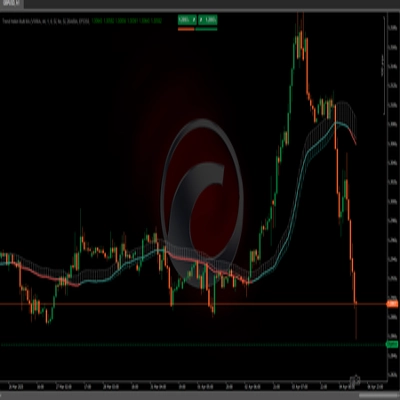
Trading product for MidasVolumeProfile مؤشر Key Levels Volume, image 2
Trading product for MidasVolumeProfile مؤشر Key Levels Volume, image 3
Trading product for MidasVolumeProfile مؤشر Key Levels Volume, image 4
منذ 27/09/2026

الوصف

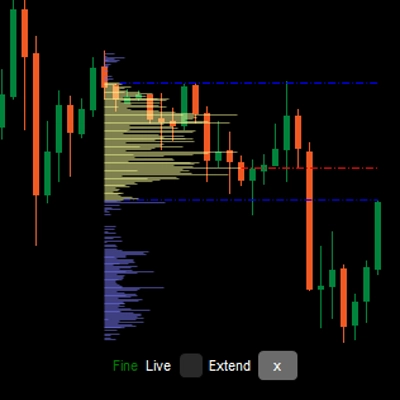
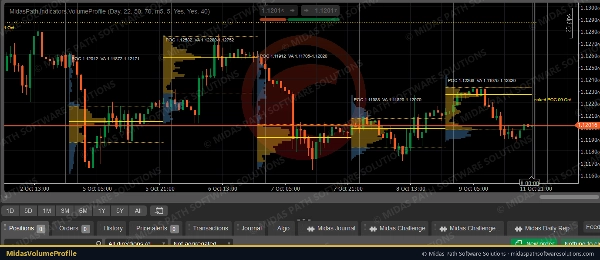
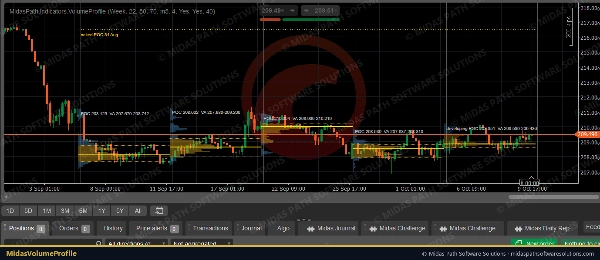
Midas Volume Profile shows where volume traded in each day or week, drawn as a histogram at the start of the session, with the levels profile traders use.


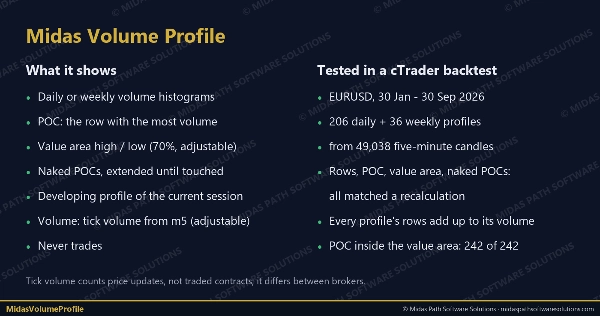
What it shows

• A volume histogram for each session, with the value area highlighted.

• POC (point of control): the price row with the most volume, drawn across the session.

• Value area high and low (VAH / VAL): the range around the POC that holds 70% of the session's volume (adjustable).

• Naked POCs: earlier sessions' POCs that price has not traded through since, extended to the right until price touches them.

• The developing profile of the current session, updated as each candle closes.


How it is built

• Volume is cTrader's tick volume (the number of price updates), the usual measure in forex and CFDs, where there is no central exchange volume. It is taken from a lower timeframe (5 minutes by default) for detail.

• Each candle's volume is shared across the price rows its high-low range covers, in proportion to the overlap. The session's range is split into 50 rows (adjustable).

• The value area grows from the POC towards whichever neighbouring row holds more volume, until it holds the chosen share.


Settings

• Profiles per day or per week, session start hour (22:00 UTC by default, the forex day), rows, value-area share, volume timeframe.

• Number of sessions shown, developing session on or off, naked POCs on or off, histogram width and colours.


Tested

• In a cTrader backtest on EURUSD (30 Jan-30 Sep 2026), all 206 daily and 36 weekly profiles built from 49,038 five-minute candles matched an independent recalculation: session boundaries, every row's volume (each profile's rows add up to its total volume), POC, value area and every naked-POC touch.

• On that data the POC sat inside the value area in every profile, the value area held 71% of volume on average (rows are whole, so it slightly exceeds 70%), and 10 daily and 2 weekly POCs were still naked at the end.


Notes

• Tick volume counts price changes, not traded contracts; it differs between brokers.

• Volume profiles describe where trading happened; they do not predict where price will go.

• It never trades and needs no internet or file access.

الملخص

ملخص الذكاء الاصطناعي
Midas Volume Profile is an indicator that visualizes session volume distribution using tick volume data, primarily for forex and CFD markets where centralized volume is unavailable. It displays a histogram of traded volume for each day or week at the session start, highlighting key levels used by volume profile traders.

Key features include:
- Point of Control (POC): the price level with the highest traded volume, extended across the session.
- Value Area High and Low (VAH/VAL): price range around the POC containing approximately 70% of the session’s volume, adjustable by the user.
- Naked POCs: POCs from previous sessions that price has not revisited, extended until touched.
- A developing profile for the current session, updated with each candle close.

The indicator calculates volume by distributing each candle’s tick volume proportionally across price rows within its high-low range, dividing the session range into adjustable rows (default 50). It supports profiles per day or week, customizable session start times, and visual settings such as histogram width and colors.

Midas Volume Profile operates without trading or internet access and has been tested for accuracy against independent recalculations on EURUSD data. It provides a detailed view of where trading activity concentrates but does not predict price direction.
ملف تعريف المؤشر
فئة المؤشر
الحجم
نوع المخرجات
التصور
متطلبات البيانات
أعمدة السعر فقط

مناقشة

تقييمات العملاء

0.0
التقييمات: 0
تقييمات العملاء
لا توجد تقييمات لهذا المنتج حتى الآن. هل جرَّبته بالفعل؟ كن أول من يخبر الآخرين!

الأسئلة الشائعة

Key Levels
Volume
Support & Resistance
يتم توفير المنتجات المتاحة من خلال cTrader Store، بما في ذلك روبوتات التداول والمؤشرات والإضافات، من قبل مطوري الطرف الثالث وإتاحتها لأغراض الوصول المعلوماتي والفني فقط. cTrader Store ليس وسيطًا ولا يقدم نصائح استثمارية أو توصيات شخصية أو أي ضمان للأداء المستقبلي.

المزيد من هذا المؤلف

إضافة سطح المكتب
File Access
Trade Journal
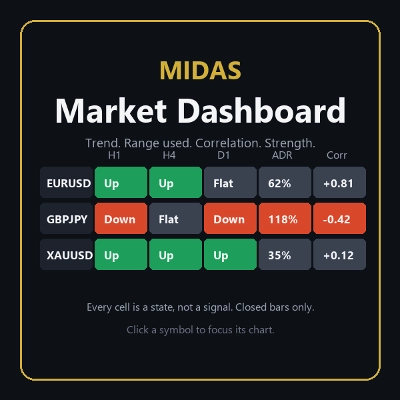
Your watchlist in one grid: trend on five timeframes, ADR used, correlation to the chart's symbol, currency strength.
مؤشر
Key Levels
Liquidity Grab
+2
The levels you mark each morning, drawn and followed: PDH/PDL, weekly, monthly, sessions, equal highs/lows.
cBot
Partial Close
Prop Firm Fit
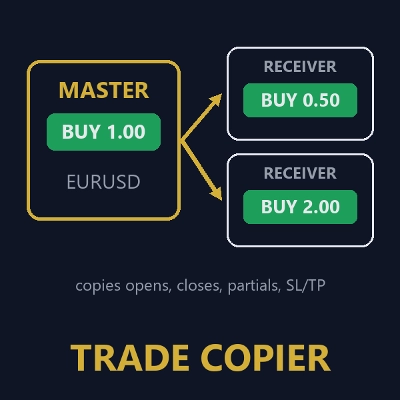
Copies opens, closes, partial closes and SL/TP from one cTrader account to others on the same PC, with safe sizing.
إضافة سطح المكتب
External Data
Study economic event reactions with broker M1 history, bar replay, range comparisons and a reproducible export.

قد يعجبك أيضًا

شعار "QX SmartStructure"
الأعلى تقييمًا
4.7
(4)
$26
/
$50
مؤشر
AI
ATR
+26
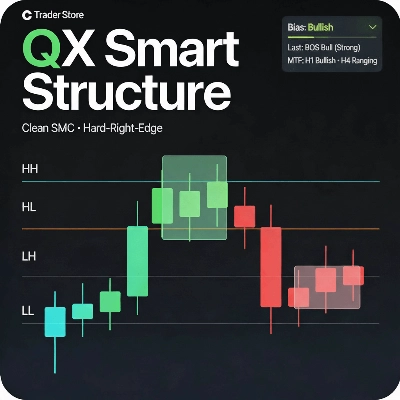
SMC without the mess: Clean structure + auto-managing FVGs + MTF panel. Hard-right-edge, step size-based for any symbol.
مؤشر
ATR
EMA
+5
Candle timer with live profit tracking on chart – displays pips, currency value, and percentage in real time.
مؤشر
Volume
Key Levels
+5
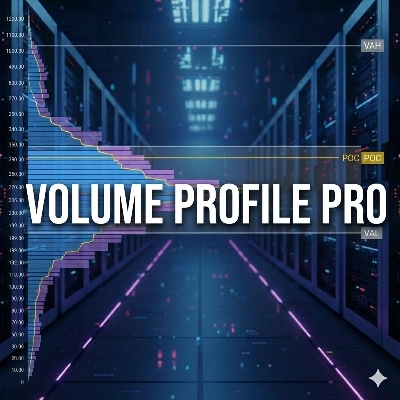
Volume Profile Pro v2 - A Lightweight and Highly Customizable Side & Range Volume Profile
شعار "FAIR VALUE GAP INDICATOR"
الأعلى تقييمًا
4.7
(4)
$19
/
$25
مؤشر
SMC
Forex
+5
Pinpoint FVGs, track fills and see mitigation stats — trade imbalances with clarity and confidence.
مؤشر
ATR
RSI
+4
RSI bands drawn on price, confluence-scored BUY/SELL signals, an ATR stop with three targets
مؤشر
ATR
MSS
+5
Advanced market structure and institutional cycle mapper with visual reference cards and entry alerts
مؤشر
Customize your Moving Average! Choose any timeframe and price source for precision and flexibility in your analysis.
مؤشر
RSI
Breakout
+1
🚀 TrendHeikinMultiMA: Advanced trend detection using Heikin-Ashi smoothing & MAs! Eliminates noise, confirms real trend
مؤشر
RSI
MACD
+1
Precision Supply & Demand zones indicator—automatically plots key buy/sell areas on your chart for smarter entries.
مؤشر
ATR
RSI
+1
Super Trend Rsi ,ATR + trend change distance + dynamic Alpha, divergence/convergence
مؤشر
Parabolic SAR Alert - Trend reversal alerts with smart signals & custom alerts.
مؤشر
ATR
Volume
+3
Volume profile key levels - POC, value area, volume peaks and troughs - with break, rejection and retest signals
مؤشر
AI
ATR
+27
Market Cipher B
مؤشر
Forex
Flexible Volume Profile, designed with performance in mind.
مؤشر
Volume
Support & Resistance
Compare up to 27 symbols across eight timeframes with seven analysis engines and an interactive cTrader dashboard.
مؤشر
ATR
RSI
+6
Market structural patterns , specifically the concepts of Change of Character (ChoCH) 🔄 and Break of Structure (BoS) 💥
مؤشر
AI
MACD
+8
A precision-engineered indicator designed for traders who demand signal integrity across volatile markets.
مؤشر
ADX
ATR
+5
SuperTrend signals scored on five confluence factors, with an ATR stop, three targets and a dashboard.

السعر

منذ 27/09/2026