Opis
Czy masz trudności z określeniem właściwego kierunku rynku na początku swojej sesji? Daily Bias Candles & Levels Indicator całkowicie automatyzuje Twoją codzienną analizę.
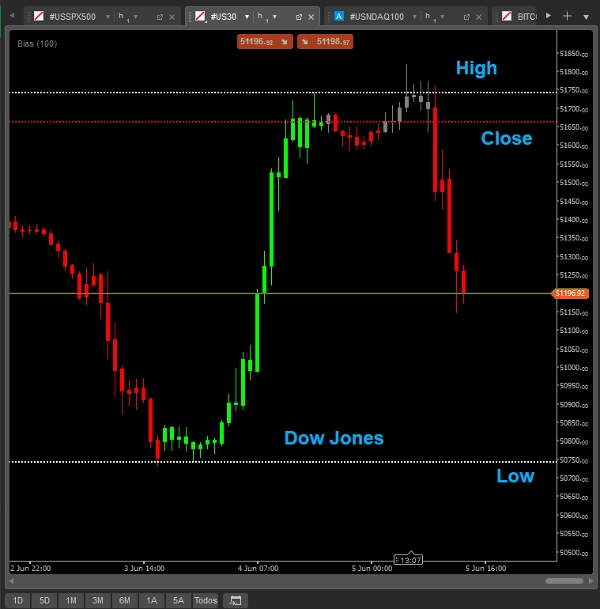
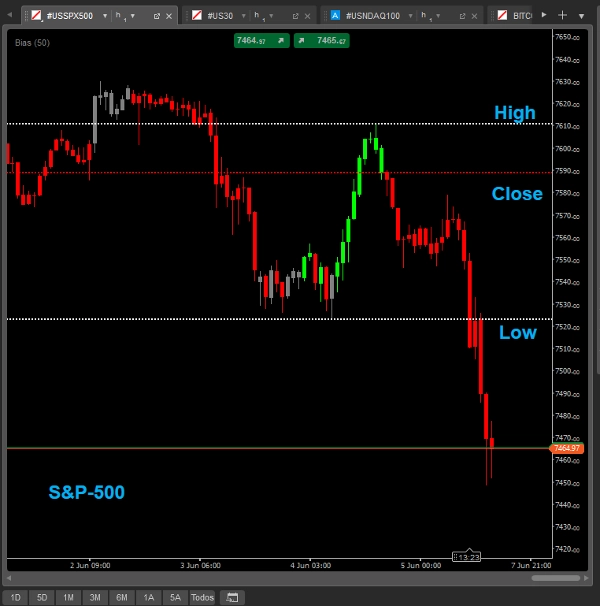
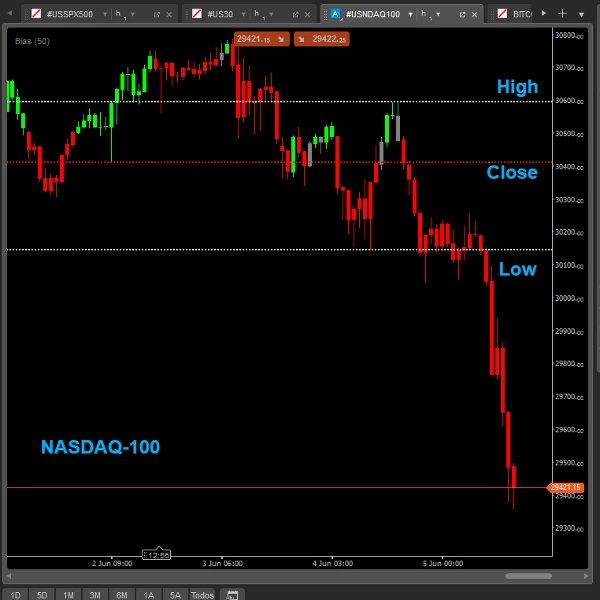
Algorytm matematycznie oblicza maksimum (High), minimum (Low) oraz cenę zamknięcia (Close) poprzedniej sesji dla dowolnego aktywa. Na podstawie tych kluczowych poziomów wskaźnik precyzyjnie określa, czy rynek znajduje się w strefie kontynuacji wzrostowej, kontynuacji spadkowej, fazie korekty lub fazie bocznej.
Aby nie tracić koncentracji podczas handlu, wskaźnik koloruje świece w czasie rzeczywistym. Natychmiast przypomina Ci, czy jesteś powyżej czy poniżej kluczowych poziomów, pozwalając na realizację strategii zgodnych z prawdziwym instytucjonalnym nastawieniem dnia.
Jak działa mapowanie stref i świec?
- Strefy kontynuacji wzrostowej (Bullish Extension): Świece w niestandardowym kolorze, gdy cena przebija i utrzymuje się mocno powyżej poprzedniego maksimum. Czas na poszukiwanie ekspansji w górę!
- Strefy kontynuacji spadkowej (Bearish Extension): Świece w niestandardowym kolorze, gdy cena notowana jest poniżej poprzedniego minimum. Idealne do podążania za masywnymi impulsami sprzedaży.
- Fazy korekty / zakres boczny: Neutralne lub ostrzegawcze kolory, gdy cena jest uwięziona między poprzednim maksimum/minimum a ceną zamknięcia. Chroni Cię przed handlem w brudnych strefach akumulacji lub pułapkach rynkowych.
Optymalizuj swój plan tradingowy, unikaj handlu po niewłaściwej stronie rynku i podążaj za płynnością inteligentnych pieniędzy. Pobierz swoją wersję już dziś!