Beschreibung
HRango: Meistere Preisaktionskontinuität & Ablehnung auf Range-Charts
Bringen Sie Ihre Preisaktionsanalyse auf die nächste Stufe. HRango ist ein fortschrittlicher Indikator für cTrader, der speziell für Trader entwickelt wurde, die Range Bars verwenden. Seine Hauptfunktion besteht darin, die aktuellen Schlussgrenzen der Kerze visuell darzustellen, sodass Sie proaktiv Trades ausführen können, bevor sich der Markt verändert.
🚀 So funktioniert es
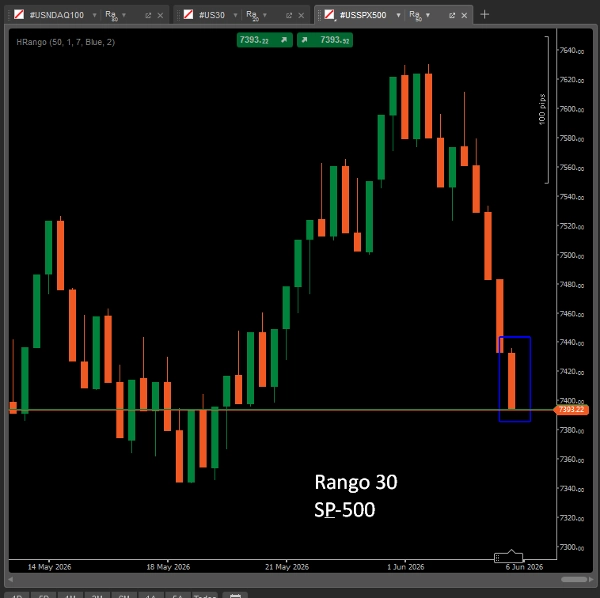
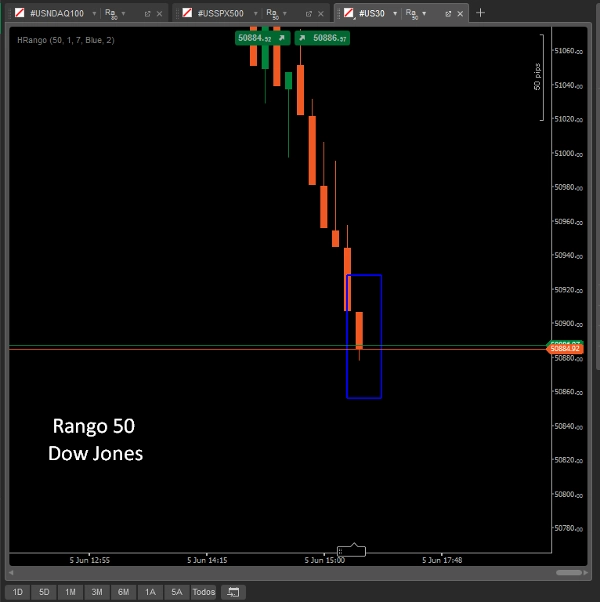
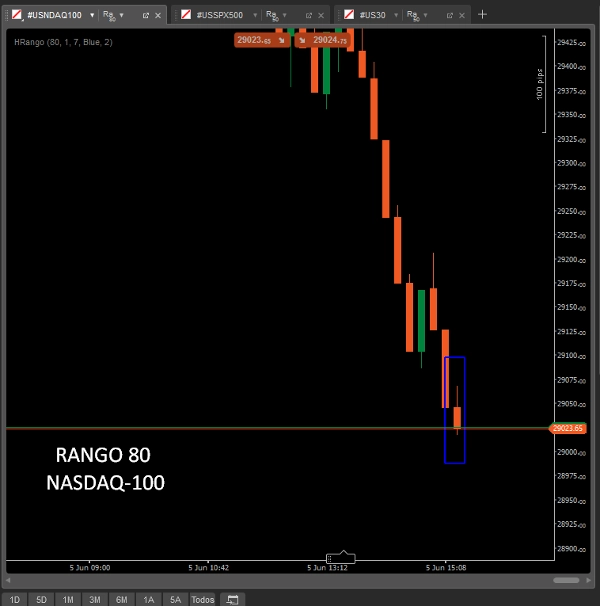
Der Indikator zeichnet dynamisch ein Begrenzungsfeld um die aktive sich entwickelnde Kerze. Durch die Berechnung kritischer Preisgrenzen hilft er Ihnen, mit mathematischer Präzision zu bestimmen, ob die aktuelle Kerze Trendkontinuität bestätigt oder ein strukturelles Ablehnen an wichtigen Unterstützungs- und Widerstandsbereichen signalisiert.
🎯 Hauptmerkmale:
- Dynamische visuelle Anker: Zeichnet ein Echtzeit-Vorhersagefeld, das genau auf Ihre aktive Range-Einstellung zugeschnitten ist.
- Sofortige Entscheidungsfindung: Erkennen Sie auf einen Blick, ob das Preismomentum anhält oder eine Marktumkehr bevorsteht.
- Rauschunterdrückung: Perfekt für hochvolatile Assets wie Nasdaq (#USNDAQ100), Forex-Paare und Indizes.
- Vollständig anpassbar: Passen Sie problemlos Parameter für die Range-Größe, die Dicke der Feldgrenzen und Farben an, um Ihre dunklen oder hellen Chartvorlagen zu ergänzen.
📈 Strategischer Vorteil
Der Handel mit Range Bars eliminiert das Rauschen der Zeit und konzentriert sich ausschließlich auf die Preisbewegung. Mit HRango müssen Sie nicht mehr raten, wo die aktuelle Kerze schließen könnte. Sie erhalten eine klare, strukturelle Karte, um Einstiege, Stop-Losses und Take-Profits mit maximalem Vertrauen zu verwalten.


![„Gaussian Channel [Iridio Capital]“-Logo](https://cdn.ctrader.com/image/webp/7c039209-5573-4a54-a072-f9528b503103_41960)


