present
新規登録で初回購入時に$50オフ
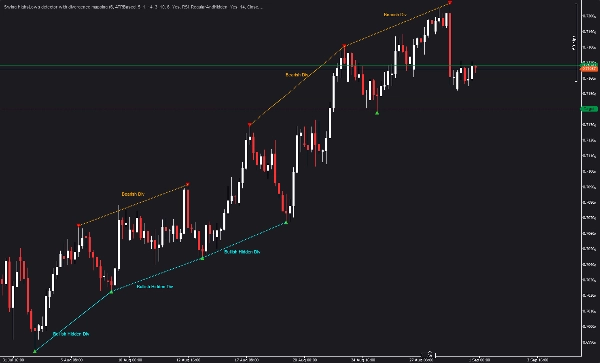
Trading product for Swing HighsLows detector with divergence mapping インジケーター Key Levels RSI, image 1
Swing HighsLows detector with divergence mapping
インジケーター
85 ダウンロード数
バージョン 1.0、Aug 2026
Windows、Mac
4.6
レビュー: 5
Trading product for Swing HighsLows detector with divergence mapping インジケーター Key Levels RSI, image 2
Trading product for Swing HighsLows detector with divergence mapping インジケーター Key Levels RSI, image 3
Trading product for Swing HighsLows detector with divergence mapping インジケーター Key Levels RSI, image 4
Trading product for Swing HighsLows detector with divergence mapping インジケーター Key Levels RSI, image 5
Trading product for Swing HighsLows detector with divergence mapping インジケーター Key Levels RSI, image 6
Trading product for Swing HighsLows detector with divergence mapping インジケーター Key Levels RSI, image 7
登録日 14/01/2025
5
販売
424
無料インストール

説明

スイング高値安値検出器


ダイバージェンス分析によるスイング検出


--------------------------------------------------


スイングを特定。ダイバージェンスを見つける。コンフルエンスで取引。


--------------------------------------------------


このインジケーターの機能


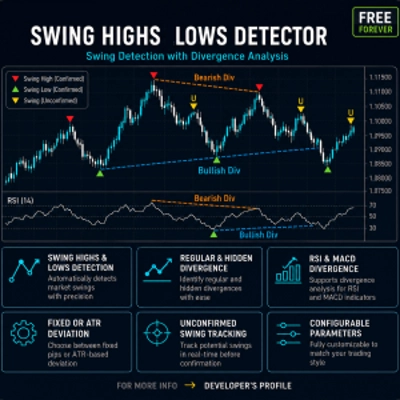
このインジケーターは、設定可能な深さと偏差フィルタリングを使用して構造的なスイング高値と安値を自動的に検出します。次に、RSIとMACDを分析して、同じタイプの連続するスイング間の通常および隠れたダイバージェンスを検出します。


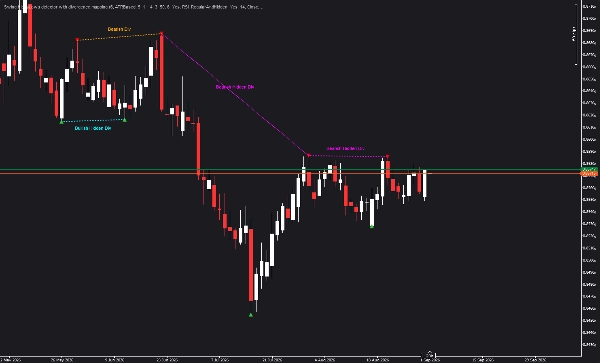
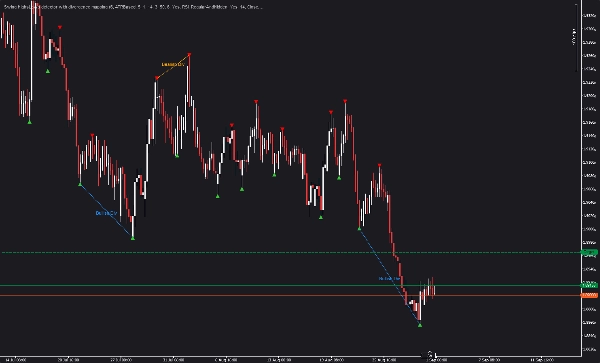
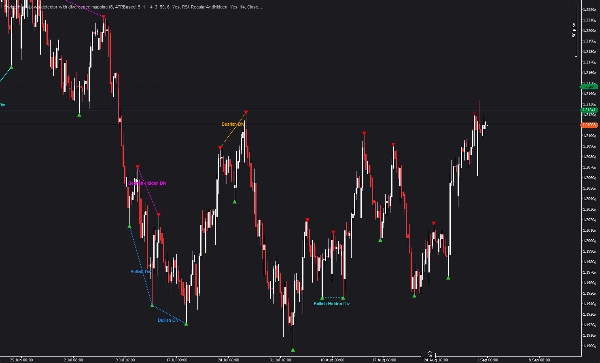
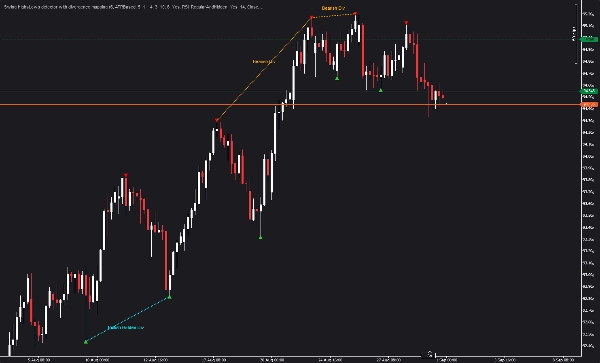
ダイバージェンスは強力な反転シグナルです。通常のダイバージェンスは潜在的なトレンド反転を示し、隠れたダイバージェンスは潜在的なトレンド継続を示します。このインジケーターは両方を識別し、チャート上に直接表示します。


--------------------------------------------------


コアロジックと計算


インジケーターは、設定可能な深さを持つ局所極値アルゴリズムを使用してスイングポイントを検出します。各スイングポイントは偏差閾値に対して検証され、重要なスイングのみが表示されます。偏差はピップ単位で固定するか、ATRを使用してボラティリティに適応させることができます。


スイングが特定されると、インジケーターは各スイングポイントでRSIとMACDの値を計算します。次に、同じタイプの連続するスイング(高値から高値、安値から安値)を比較して通常および隠れたダイバージェンスを検出します。通常のダイバージェンスは、価格がより高い高値をつけるがRSI/MACDがより低い高値をつける場合(弱気)、または価格がより低い安値をつけるがRSI/MACDがより高い安値をつける場合(強気)に発生します。隠れたダイバージェンスは、価格がより低い高値をつけるがRSI/MACDがより高い高値をつける場合(弱気)、または価格がより高い安値をつけるがRSI/MACDがより低い安値をつける場合(強気)に発生します。


ダイバージェンスのソースはRSI、MACD、または両方から選択できます。ダイバージェンスのタイプは通常のみ、隠れたのみ、または両方から選択できます。未確認のスイングもダイバージェンス検出に含めることができ、より早いシグナルを提供します。


現在のスイング状態マシンは、まだ形成中の未確認スイング(U)を追跡します。これらのスイングは黄色で表示され、価格の動きに応じて確認済みまたは無効に昇格されます。


--------------------------------------------------


主な特徴


- 自動スイング検出:設定可能な深さと偏差フィルタリングを使用してスイング高値と安値を識別します。

- 通常のダイバージェンス検出:潜在的なトレンド反転を示すクラシックなダイバージェンスシグナルを識別します。

- 隠れたダイバージェンス検出:潜在的なトレンド継続を示す隠れたダイバージェンスシグナルを識別します。

- RSIおよびMACDダイバージェンス:ダイバージェンスのソースとしてRSI、MACD、または両方を選択可能。

- 設定可能な偏差:固定ピップまたはATRベースの偏差で市場のボラティリティに適応。

- 未確認スイング追跡:形成中の潜在的なスイング(U)を表示。

- ルックバック制御:パフォーマンス最適化のために表示されるスイングポイントの数を制限。

- カスタマイズ可能な色:確認済み高値、確認済み安値、未確認スイング、およびダイバージェンスタイプごとに色を分ける。

- リペイントなし:すべての計算は過去のデータに基づいています。


--------------------------------------------------


パラメーターガイド


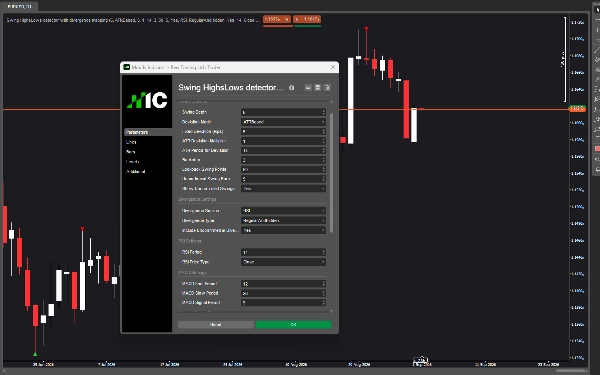
スイング設定


スイング深さ:このパラメーターは、バーの両側で何本のバーをチェックしてスイング高値または安値かどうかを判断するかを制御します。値が高いほど、より少なく重要なスイングが生成されます。値が低いほど、より多くのスイングが生成されます。デフォルトは10です。M5やM15などの低い時間枠では6から8を検討してください。H4以上の高い時間枠では12から16を検討してください。


偏差モード:このパラメーターは固定ピップとATRベースの偏差のどちらかを選択します。固定ピップはスイング間の一定の最小価格距離を使用します。ATRベースは現在のATR値の乗数を使用してボラティリティに適応します。デフォルトは固定ピップです。


固定偏差(ピップ):固定ピップモードを使用する場合、このパラメーターは連続するスイング間の最小ピップ距離を設定します。デフォルトは5.0です。この値を増やすと小さなスイングを除外し、より大きな構造的な動きに集中できます。減らすとより多くのスイングを捉えます。


ATR偏差乗数:ATRベースモードを使用する場合、このパラメーターは現在のATR値に乗算して最小偏差を決定します。デフォルトは0.5です。値が高いほどスイングは少なくなり、低いほど多くなります。


偏差のためのATR期間:ATRベースモードを使用する場合、このパラメーターはATR計算の期間を設定します。デフォルトは14です。短い期間はより敏感なATR値を生成し、長い期間はより滑らかな値を生成します。


バックステップ:このパラメーターはスイング間の最小バー数を設定します。デフォルトは3です。この値を増やすとスイングが近接して表示されるのを防ぎ、減らすとより頻繁なスイングを許可します。


ルックバックスイングポイント:このパラメーターはパフォーマンス最適化のために表示されるスイングポイントの数を制限します。デフォルトは50です。より多くの履歴コンテキストが必要な場合は増やし、遅いマシンでのパフォーマンス向上のために減らしてください。


未確認スイングバー:このパラメーターは潜在的なスイングの後、より良い候補を探すためにインジケーターが見るバーの数を設定します。デフォルトは3です。値が高いほどより良いスイングが形成される時間が増え、低いほどシグナルが速くなります。


未確認スイングの表示:有効にすると、潜在的なスイング(U)が確認される前に黄色で表示されます。デフォルトはtrueです。確認済みスイングのみを表示してチャートをすっきりさせたい場合は無効にしてください。


ダイバージェンス設定


ダイバージェンスソース:このパラメーターはダイバージェンス検出に使用するインジケーターを選択します。選択肢はRSI、MACD、またはRSIAndMACDです。RSIAndMACDは両方のインジケーターがダイバージェンスを示した場合にのみシグナルを生成します。デフォルトはRSIです。


ダイバージェンスタイプ:このパラメーターは検出するダイバージェンスのタイプを選択します。選択肢はRegularOnly、HiddenOnly、またはRegularAndHiddenです。デフォルトはRegularAndHiddenです。


未確認をダイバージェンスに含める:有効にすると、未確認スイングを現在のスイングとしてダイバージェンス検出に使用できます。デフォルトはtrueです。無効にすると、両方のスイングが完全に確認されるまでダイバージェンスは表示されません。


RSI設定


RSI期間:このパラメーターはRSI計算の期間を設定します。デフォルトは14です。標準値は9から25の範囲です。短い期間はより敏感なRSI値を生成し、長い期間はより滑らかな値を生成します。


RSI価格タイプ:このパラメーターはRSI計算に使用する価格系列を選択します。選択肢にはClose、Open、High、Low、Typical、Median、Weightedがあります。デフォルトはCloseです。


MACD設定


MACD高速期間:このパラメーターはMACD計算の高速EMA期間を設定します。デフォルトは12です。


MACD低速期間:このパラメーターはMACD計算の低速EMA期間を設定します。デフォルトは26です。


MACDシグナル期間:このパラメーターはMACD計算のシグナルライン期間を設定します。デフォルトは9です。


ビジュアル


高スイング色:確認済みスイング高値の色。デフォルトは赤。


低スイング色:確認済みスイング安値の色。デフォルトはライムグリーン。


未確認高スイング色:未確認スイング高値(U)の色。デフォルトは黄色。


未確認低スイング色:未確認スイング安値(U)の色。デフォルトは黄色。


強気の通常ダイバージェンス色:強気の通常ダイバージェンスラインの色。デフォルトはドジャーブルー。


弱気の通常ダイバージェンス色:弱気の通常ダイバージェンスラインの色。デフォルトはオレンジ。


強気の隠れたダイバージェンス色:強気の隠れたダイバージェンスラインの色。デフォルトはシアン。


弱気の隠れたダイバージェンス色:弱気の隠れたダイバージェンスラインの色。デフォルトはマゼンタ。


ラベル表示:有効にすると、チャート上にダイバージェンスラベルが表示されます。デフォルトはtrueです。


ラベルフォントサイズ:このパラメーターはダイバージェンスラベルのフォントサイズを設定します。デフォルトは8です。


ダイバージェンスラベルオフセット(ピップ):このパラメーターはダイバージェンスラベルがダイバージェンスラインからどれだけ離れて表示されるかを制御します。デフォルトは10です。


--------------------------------------------------


使用例


- 市場構造分析のための構造的スイング高値と安値の特定

- 潜在的な反転シグナルのための通常のダイバージェンス検出

- 潜在的なトレンド継続シグナルのための隠れたダイバージェンス検出

- ダイバージェンスシグナルと価格アクションを組み合わせて高確率の取引

- エントリーおよびエグジットの判断にRSIとMACDのダイバージェンス確認を使用

- 早期シグナル検出のための未確認スイングの追跡


--------------------------------------------------


推奨ワークフロー


ステップ1:デフォルト設定でインジケーターをチャートに追加します。

ステップ2:確認済みのスイング高値と安値(赤と緑の三角形)を特定します。

ステップ3:連続するスイングを結ぶダイバージェンスライン(青、オレンジ、シアン、マゼンタ)を探します。

ステップ4:通常のダイバージェンスを潜在的な反転として、隠れたダイバージェンスを潜在的な継続として解釈します。

ステップ5:取引を開始する前に価格アクションや他のインジケーターでダイバージェンスシグナルを確認します。


--------------------------------------------------


技術的注意事項


- 価格チャートに直接描画するオーバーレイインジケーター

- すべての時間枠とシンボルで動作

- 設定可能なスイング検出およびダイバージェンスパラメーター

- リペイントなし;すべての計算は過去のデータに基づく

- ルックバック制御によるパフォーマンス最適化

- cTrader対応


--------------------------------------------------


サポート


生涯アップデートが含まれています。


詳細については、下の開発者プロフィールをクリックしてください。

概要

AIによる概要
This indicator automatically detects structural swing highs and lows on price charts using configurable depth and deviation filters, adaptable via fixed pips or ATR-based volatility measures. It analyzes RSI and MACD momentum indicators to identify both regular and hidden divergences between consecutive swings of the same type. Regular divergences signal potential trend reversals, while hidden divergences suggest trend continuations. Users can select divergence sources (RSI, MACD, or both) and divergence types (regular, hidden, or both). The indicator tracks unconfirmed swings in real-time, displaying them distinctly to provide early signals. Visual elements include customizable colors for confirmed and unconfirmed swings and divergence lines, with optional labels for clarity. It operates as an overlay on any timeframe and symbol within the cTrader platform, using historical data only to avoid repainting. Performance is optimized through lookback limits on swing points. Key parameters allow users to tailor swing detection sensitivity, divergence criteria, and visual presentation. Typical use cases include market structure analysis, identifying reversal and continuation signals, and combining divergence with price action for trade decision support. The indicator supports systematic swing and divergence analysis to assist traders in interpreting momentum shifts and structural price changes.
インジケーターのプロフィール
インジケーターのカテゴリー
サポート&レジスタンス
出力の種類
ビジュアル表示
シグナル
フィルター
データ要件
バーのみ
サポート対象のシグナル
ダイバージェンス
ブレイクアウト
反転
トレンドの強さ
ボラティリティ
ラインタッチ
ラインブレイク

ディスカッション

カスタマーレビュー

4.6
レビュー: 5
5
60 %
4
40 %
3
0 %
2
0 %
1
0 %
カスタマーレビュー
October 28, 2026
Depth and deviation are useful controls rather than decoration here. They determine which swings enter the RSI or MACD divergence map, with both regular and hidden patterns available. A fairly focused option for adding oscillator context to market structure.
October 15, 2026
Giving unfinished swings a visibly different status is an excellent detail. It makes these RSI and MACD divergence markings easier to interpret without confusing a developing idea with confirmed structure. That distinction is more valuable than simply drawing more lines.
October 11, 2026
Tested on EURUSD and XAUUSD across H1 and M1. Swing highs/lows and divergence mapping rendered clearly, with bullish, bearish and hidden divergences visible across the tested history. The configurable structure and color separation make the tool easy to read, while historical objects remained consistent. No visible functional issues were found.
October 2, 2026
swing structure gives the regular and hidden RSI or MACD divergence markings a clearer purpose. Depth and deviation adjust what qualifies, with developing swings kept distinct from confirmed ones rather than treating every oscillator wiggle alike.
October 1, 2026
Hidden divergence gets the same attention as the regular kind, which adds real depth to the swing analysis. The adjustable depth and deviation keep the mappings tied to a defined structure. A thoughtful approach for anyone studying how oscillator behaviour relates to price swings.

よくあるご質問

Key Levels
RSI
BOS
Market Structure
ATR
MACD
Support & Resistance
cTrader Storeで入手可能な取引ボット、インジケーター、プラグインなどの商品は、第三者の開発者が提供するものであり、情報と技術の取得のみを目的としてご利用いただけます。cTrader Storeはブローカーではなく、投資助言や個人的な推奨を行うことも、将来のパフォーマンスを保証することもありません。

この作成者の他の商品

インジケーター
ATR
RSI
+5
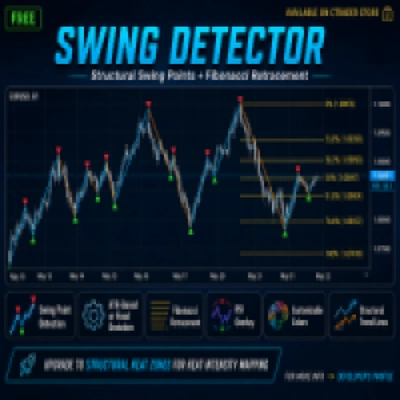
Free swing detector with Fibonacci retracement and RSI overlay. Auto-deviation adapts to any timeframe
インジケーター
Volume
Imbalance
+1
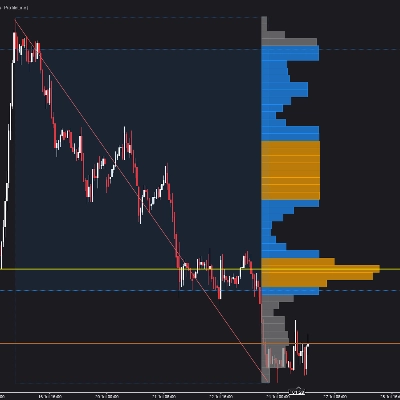
Volume profile indicator that auto-detects the latest trendline. Shows POC, Value Area (VAH/VAL), and High Volume Nodes
「VWAP Ribbons」ロゴ
トップ評価
4.7
(4)
無料
インジケーター
ATR
RSI
+4
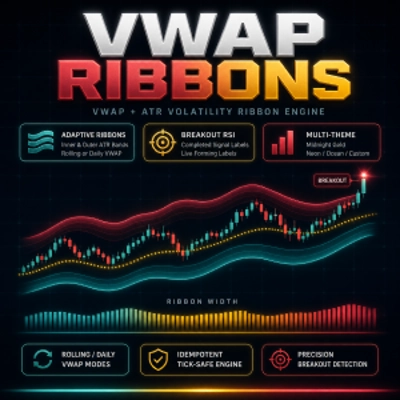
VWAP with ATR ribbon bands and RSI labels on completed breakouts — live forming labels on cTrader.
インジケーター
BOS
Flag
+5
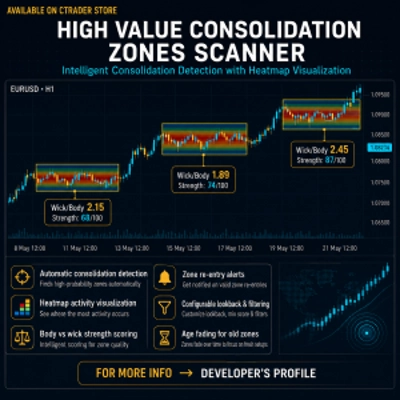
Detect consolidation zones. Heatmap shows activity density. Body vs wick scoring reveals true strength zones.
インジケーター
ATR
EMA
+5
Multi-factor volatility squeeze detector, dual-trend scoring & breakout validation dashboard. No repaint.
インジケーター
EMA
Channel
+3
Real-time squeeze detection, dual-horizon trend scoring & institutional breakout validation HUD dashboard.
インジケーター
ATR
RSI
+5
Multi-factor VWAP mean-reversion signals with ATR bands, volume exhaustion, and RSI gate on cTrader.
インジケーター
MSS
Volume
+3
Rejection-based volume profile with tiered heat zones, POC levels and a fully draggable anchor on cTrader.
cBot
ATR
Wedge
+5
15 YEARS RESULTS :Win rate:93% | ROI+19000% | Trades:87,000 | Profit Factor 1.2 | Currency Pairs:22 | $10k to 500k$ |
1.2
プロフィットファクター
インジケーター
MSS
VWAP
+5
VWAP mean-reversion signals combined with a ribbon-anchored volume profile, VAH/VAL, POC and HVN levels.
インジケーター
ATR
BOS
+5
Heat intensity mapping of structural participation. See where price fights, where it accepts, and where it rejects .
インジケーター
RSI
Volume
+3
Auto-detects swings, Includes POC, Value Area (VAH/VAL), High Volume Nodes (HVN), Fibonacci retracement, and RSI overlay

これも好きかも

インジケーター
AI
ATR
+26
SR Commander — Multi Timeframe Edition. See where the big money draws the line. Trade on your timeframe. Think on theirs
インジケーター
Volume Profile plots traded volume at each price level, highlighting high activity zones of precise support & resistance
インジケーター
Doji
Wedge
+5
Angora Pattern Recognition is a cTrader indicator that finds, draws and tracks classic chart patterns automatically.
インジケーター
VWAP
Support & Resistance
Trading.FC$_vwap Algo shows VWAP trends, dynamic support/resistance and deviation bands to spot potential trade entries.
インジケーター
SMC
Pro Volume Profile with Delta, Session Filters & CSV Export. Precision order flow analysis.
インジケーター
Forex
BTCUSD
+6
All-In-One solution for ICT's FVG IFVG ORDERBLOCK in advanced mode.
インジケーター
RSI
Breakout
+1
📊 Liquidation Map: Potential areas where highly leveraged investors might face liquidations.
インジケーター
MACD
Forex
+5
🚀 MACD Pro Trader – Advanced MACD with buy/sell signals, custom MAs & color-coded histograms for smarter trading! 📈🔥
インジケーター
RSI
MACD
This indicator is a combination of MACD and RSI into one. This is perfect fusion and powerful indicator ever.
インジケーター
AI
Forex
+5
Dynamic, color‑coded candles reveal market shifts instantly—spot momentum and trend reversals at a glance
インジケーター
show symbol and time fram, daily net profit percent, daily net profit, and spread ln your chart. consider that timezone
インジケーター
Volume
Key Levels
View tick activity across a selected chart range with Point of Control, Value Area High and Value Area Low.
インジケーター
ATR
RSI
+9
🚀 MACARX Indicator - The Multi-Indicator Trend Fusion 🚀
インジケーター
Forex
BTCUSD
+5
Buy-Side & Sell-Side Liquidity (BSL/SSL) Indicator
インジケーター
Key Levels
Trend-filtered signals, transparent trade plans and a multi-timeframe decision panel for cTrader.
インジケーター
Prop
Forex
NEW - PNLs as % - daily, weekly, monthly, or yearly & Spread, Time To Close, PNL Alerts, custom Bid / Ask lines
インジケーター
BOS
EMA
+5
Market structure signals graded A to C, each with a drawn trade plan, plus an adaptive trend ribbon and a trend matrix
インジケーター
RSI
EURUSD
+2
It identifies areas of market imbalance (Fair Value Gaps or FVGs) and projects them on the chart in a smart way

価格

登録日 14/01/2025
5
販売
424
無料インストール