
Penerangan
Penunjuk Price Jump Exit and Re-entry (PjER) adalah penunjuk pengurusan risiko berdasarkan kertas akademik “A dynamic price jump exit and reentry strategy for intraday trading” oleh Koegelenberg & van Vuuren (2024), Diterbitkan dalam Jurnal Expert Systems With Applications.
Inovasi Utama
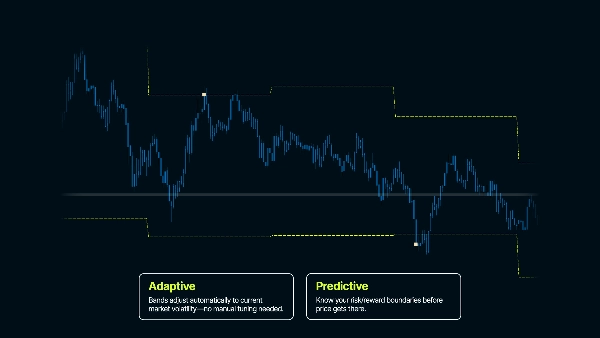
- Anggaran VaR kerugian berpotensi sebelum ia berlaku
- Ketahanan terhadap tren pasaran yang kuat dalam jangka masa pendek
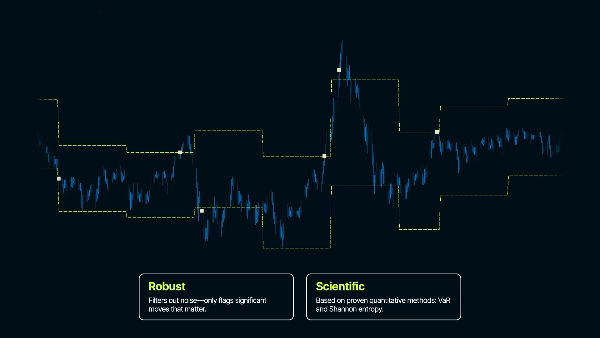
- Analisis pembetulan pasaran selepas lonjakan untuk masa masuk semula yang selamat
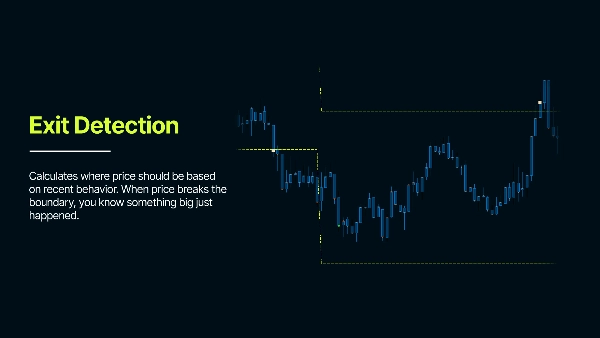
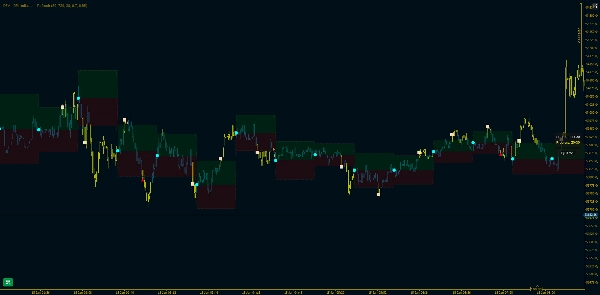
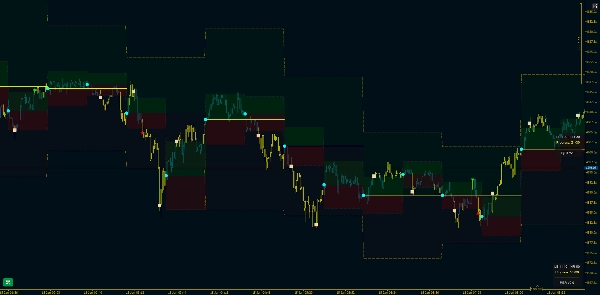
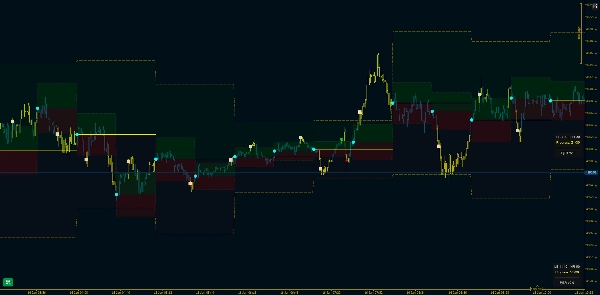
Ia menganalisis pergerakan harga lalu untuk memahami volatiliti tipikal dan Mewujudkan Selang Keyakinan - yang mewakili jangkauan harga yang dijangka. Apabila harga melompat di luar jalur ini, ia menandakan sesuatu yang luar biasa telah berlaku.
Kes Penggunaan Sasaran
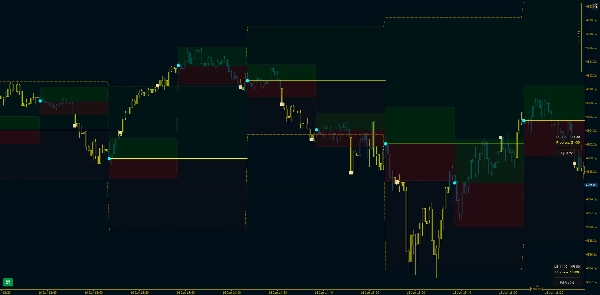
Perdagangan intrahari (terutamanya strategi berasaskan julat). Penunjuk ini mewujudkan sempadan statistik di sekitar harga untuk mengesan pergerakan harga yang luar biasa. Dalam tingkah laku pasaran biasa, harga kekal dalam julat yang dijangka berdasarkan volatiliti terkini. Apabila harga memecah jalur ini, ia menandakan sesuatu yang luar biasa sedang berlaku - titik keluar potensi dari perdagangan atau pecahan dalam struktur pasaran, kerana tingkah laku pasaran telah berubah.
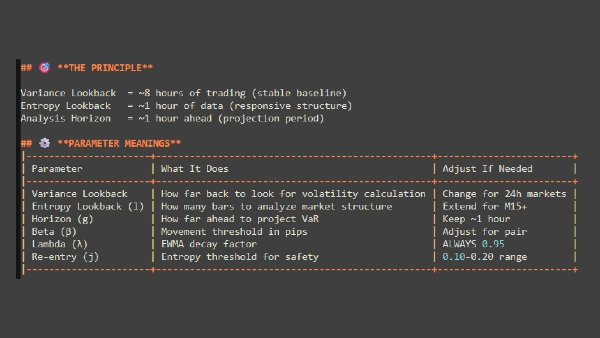
Parameter Teras Dijelaskan
Max Days Back - Menentukan sejauh mana dalam sejarah penunjuk mula berfungsi
GMT Offset - Melaraskan untuk zon masa anda. Memastikan pengiraan tarikh sepadan dengan masa tempatan anda
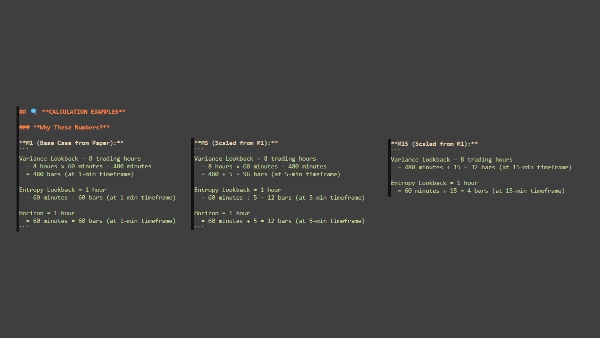
Lookback Period (bars)
"Berapa banyak sejarah harga yang harus saya gunakan untuk mengukur tingkah laku 'normal'?"
- Berapa banyak bar data sejarah yang digunakan untuk mengira volatiliti
- Lebih banyak bar = lebih stabil tetapi lambat menyesuaikan; kurang bar = reaksi lebih cepat tetapi lebih bising
- Contoh: 1440 bar pada M1 = 24 jam data
Analysis Horizon (bars)
"Berapa lama saya harus memerhati harga sebelum memulakan semula?"
- Berapa lama setiap tempoh analisis berlangsung sebelum jalur diset semula
- Menetapkan jangka masa yang anda analisis - lebih pendek = set semula lebih kerap, lebih lama = jalur kekal tetap lebih lama
- Contoh: 60 bar = jalur kekal selama 60 bar, kemudian dikira semula dari harga rujukan baru
Risk Probability
"Sejauh mana saya mahu yakin bahawa harga biasanya tidak akan mencapai tahap ini?"
- Menetapkan tahap keyakinan untuk jalur (seperti margin keselamatan)
- Nilai lebih tinggi = jalur lebih lebar (sinyal kurang), nilai lebih rendah = jalur lebih ketat (sinyal lebih banyak)
- Contoh: 0.80 = 80% keyakinan bahawa harga kekal dalam jalur dalam keadaan normal
Decay Factor (λ - Lambda)
"Patutkah saya lebih mengambil berat tentang apa yang baru berlaku atau melayan semua sejarah sama rata?"
- Mengawal berapa banyak berat yang diberikan kepada data terkini berbanding data lama dalam pengiraan volatiliti
- Nilai lebih tinggi = data terkini lebih penting; nilai lebih rendah = semua data diberi berat lebih sama rata
- Contoh 0.95 = volatiliti terkini sangat mempengaruhi pengiraan
PERKARA PENTING UNTUK DIINGAT
Ini adalah alat PENGURUSAN RISIKO – Mengenal pasti peristiwa volatiliti dan kestabilan sepanjang tempoh masa
Selang Keyakinan adalah kritikal – Jalur TIDAK harus mengikuti harga seperti ATR – Jalur dikira untuk setiap tempoh analisis
Masuk semula memerlukan kesabaran – Jangan harap masuk semula segera selepas keluar – Pasaran memerlukan masa untuk stabil
Parameter adalah khusus aset dan jangka masa – Parameter lalai adalah titik permulaan – Optimumkan untuk pasaran dan gaya anda – Apa yang berkesan dalam FX mungkin tidak berkesan untuk Indeks, Logam atau Kripto.
( * ) Penunjuk ini disediakan untuk tujuan pendidikan dan maklumat sahaja. Ia tidak bertujuan sebagai nasihat kewangan atau pelaburan. Tiada apa-apa dalam produk ini, dokumentasinya, atau mana-mana bahan berkaitan harus ditafsirkan sebagai cadangan untuk membeli, menjual, atau memegang mana-mana instrumen kewangan. Perdagangan dalam pasaran kewangan melibatkan risiko yang ketara dan mungkin tidak sesuai untuk semua pelabur. Prestasi lalu tidak menunjukkan hasil masa depan. Tiada jaminan keuntungan, dan pengguna mungkin mengalami kerugian yang besar. Dengan menggunakan penunjuk ini, anda mengakui bahawa anda bertanggungjawab sepenuhnya atas keputusan perdagangan dan hasil kewangan anda sendiri. Pencipta produk ini tidak akan bertanggungjawab atas sebarang kerugian atau kerosakan yang timbul secara langsung atau tidak langsung daripada penggunaannya. Sentiasa lakukan analisis anda sendiri sebelum membuat sebarang keputusan perdagangan.
Ringkasan
Key features include Value at Risk (VaR) estimates to anticipate potential losses, robustness against strong short-term trends, and analysis of post-jump corrections to identify safe re-entry timings. Core adjustable parameters allow users to tailor the indicator to specific assets and timeframes, including lookback period for volatility calculation, analysis horizon for band recalculation frequency, risk probability to set confidence levels, and decay factor to weight recent versus older data.
The indicator emphasizes patience for re-entry after exits, as market stabilization is required. It is intended as a tool for identifying volatility events and managing risk rather than providing direct trade signals. Users should optimize parameters according to their trading style and market conditions.
Ulasan pelanggan
5 | 100 % | |
4 | 0 % | |
3 | 0 % | |
2 | 0 % | |
1 | 0 % |


![Logo "[Stellar Strategies] Smart ADX"](https://cdn.ctrader.com/image/webp/af13b084-b6f6-41db-b7bc-c7e688b57b05_36929)


