

Penerangan
▁▂▃▄▅▆▇ █ 10,000+ pedagang (institusi + runcit) █ ▇▆▅▄▃▂▁
- Pilih penunjuk TERATAS kami di cTrader 🏆
- ✨ Ketepatan eksklusif untuk hasil yang unggul ✨
- 📈 Algoritma kami —dengan visual yang paling dinilai tinggi 🎯—
- telah berjaya dilaksanakan dalam 2 dana kuantitatif
▁▂▃▄▅▆▇ █████████████████████████████ ▇▆▅▄▃▂▁
_______________________________________________
_______________________________________________
📌 Penunjuk Struktur Pasaran
· ✅ AdvancedMarket Structure: Bos, Choch, SwinLevels, Order Blocks, Market Structure& Liquidity Finder
· 🔄 Dynamic Market StructureAnalysis of Turning Points
· 🧱 Order Block
· ⚖️ Market Imbalance
· ⛓️ BOS & CHOCH
· 🧠 ICT Power of 3
______________________________________________________________-
Simpan cBots : 🧠 Gold & BTC BreakoutSession Pivots 🧠
_______________________________________________
🔚 Sistem Keluar Pintar
_______________________________________________
📐 Penunjuk ZigZag
· 🔍 ZigZag Price LiquidityProjection
· ➖ ZigZag
_______________________________________________
🧱 Penunjuk Sokongan & Rintangan
· 🟩 SmartTrend Support &Resistance Lines
· 🧱 All Support and ResistanceLevels
_______________________________________________
📊 Penunjuk Trend & Saluran
· 📊 Supertrend
_______________________________________________
💧 Alat Isipadu & Kecairan
_______________________________________________
⚡ Penunjuk Momentum & RSI
· 🔎 Multi-Level Candle BiasTracker
_______________________________________________
🔮 Alat Ramalan & Unjuran
· 📐 Ramalan Berdasarkan Linreg& ATR
· 📏 Fibonacci Linear RegressionMulti-timeframe
· 📈 Volume-Powered Market Flow Projector
______________________________________________________________________________________________________
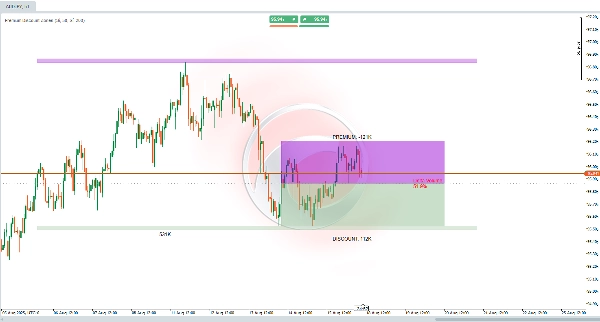
Apa Fungsi Penunjuk Zon Diskaun Premium? 🎯
Penunjuk ini direka untuk membantu anda mengenal pasti kawasan utama berdasarkan paras tinggi dan rendah pasaran terkini. Ia menganalisis tempoh boleh laras bar lalu untuk menentukan julat harga umum, mengira titik tengah keseimbangan, dan membahagikan julat itu kepada dua zon utama:
- 🔺 Premium (Zon Atas)
- 🟩 Diskaun (Zon Bawah)
Ia juga menilai volum dagangan dalam bar tersebut untuk mengira "Volume Delta", yang mewakili peratusan volum yang berkaitan dengan pergerakan menurun.
Apa Tujuannya? 💡
Penunjuk ini membantu anda mengenal pasti kawasan di mana harga mungkin:
- 📈 Dinilai terlalu tinggi (Zon Premium) → Potensi untuk menjual atau mengambil keuntungan
- 📉 Dinilai terlalu rendah (Zon Diskaun) → Potensi untuk membeli atau mengumpul
Ia memberikan pandangan pantas mengenai ketidakseimbangan pasaran, menonjolkan sama ada volum terkini memihak kepada pergerakan menaik atau menurun. Zon struktur yang diperluas meramalkan paras utama di luar julat segera, berguna untuk merancang dagangan dalam trend atau pembalikan. 🚀
Sesuai untuk strategi yang mensasarkan julatan pengukuhan, pecahan, dagangan institusi, atau analisis kecairan!
Bagaimana Menafsirkannya? 🔍
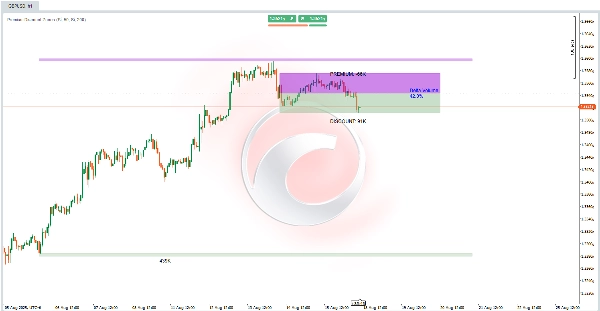
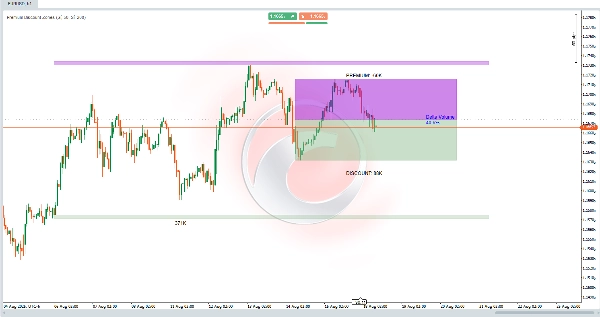
- 🟣 Zon Premium (Ungu, Di Atas Keseimbangan) → Julat atas, di mana harga dianggap "mahal."
- 🟢 Zon Diskaun (Hijau, Di Bawah Keseimbangan) → Julat bawah, di mana harga dilihat sebagai "murah."
- ⚖️ Garis Keseimbangan (Kelabu, Tengah) → Menandakan titik tengah julat, bertindak sebagai paras keseimbangan. Persilangan harga di sini mungkin menandakan perubahan kecenderungan.
- 📊 Volume Delta (Pusat) → Menunjukkan peratusan volum menurun (🔴 >50% = menurun, 🔵 <50% = menaik).
- 🏛 Zon Struktur (Sambungan Berbayang) → Kawasan yang diperluas di atas/bawah ekstrem julat, bertindak sebagai sokongan/rintangan jangka panjang dengan penampan berdasarkan tindakan harga terkini.
Penunjuk ini mengemas kini secara dinamik zon-zon ini pada bar terkini, meluaskan ke kanan untuk unjuran masa depan.
Bagaimana Menggunakannya dalam Dagangan? 🛠️
- Persediaan Awal:
-
- Dayakan tahap PD (utama) dan zon struktur jika dikehendaki.
- Laraskan tempoh tinjauan semula:
-
- Pendek (contoh, 50 bar) → Julat terkini
- Panjang (contoh, 200 bar) → Konteks struktur
- Analisis Carta (contoh, Tempoh Masa H1):
-
- Periksa jika harga berada di 🟣 Premium (pertimbangkan jualan dengan pengesahan menurun) atau 🟢 Diskaun (pertimbangkan pembelian dengan pengesahan menaik).
- Gunakan Volume Delta untuk pengesahan:
-
- 🔴 >50% → Memihak kepada posisi pendek di Premium
- 🔵 <50% → Memihak kepada posisi panjang di Diskaun
- Strategi Masuk & Keluar:
-
- 🟢 Beli di Zon Diskaun: Jika harga memasuki zon hijau & delta rendah, cari entri panjang dengan hentian di bawah paras rendah zon dan sasaran di keseimbangan atau Premium.
- 🟣 Jual di Zon Premium: Jika harga mencapai zon ungu & delta tinggi, pertimbangkan posisi pendek dengan hentian di atas paras tinggi zon dan sasaran di keseimbangan atau Diskaun.
- 🏛 Gunakan Zon Struktur untuk dagangan jangka panjang, menggunakan penampan sebagai margin ralat.
Ringkasan
The indicator also computes a Volume Delta, representing the percentage of volume associated with bearish movements, which helps confirm market bias: values above 50% favor bearish conditions, while values below 50% favor bullish conditions. Extended structural zones project key support and resistance levels beyond the immediate range, useful for planning trades in trending or reversal markets.
Users can adjust lookback periods to focus on recent ranges or broader structural context. The indicator dynamically updates these zones and extends them forward for future projections. It supports trading strategies involving consolidation ranges, breakouts, institutional trading, and liquidity analysis by providing visual cues on price valuation and volume-driven market imbalances.


