Mô tả
BullBear Dynamics — Chỉ báo Xu hướng & Đà cho cTrader
BullBear Dynamics là một chỉ báo mạnh mẽ, nhận biết biến động dành cho nền tảng cTrader, được thiết kế để giúp các nhà giao dịch phát hiện và giải thích sự cân bằng giữa đà tăng và đà giảm trên thị trường. Nó kết hợp các trung bình động, chuẩn hóa ATR và ngưỡng động để cung cấp một công cụ chính xác, trực quan để đánh giá xu hướng.
Phương pháp & Logic Nội bộ
Chỉ báo tính toán hai Trung bình Động Lũy thừa (EMA): một EMA ngắn hạn và một EMA dài hạn.
Sau đó lấy hiệu số giữa các EMA này và chia cho Phạm vi Thực trung bình (ATR). Việc chuẩn hóa này giúp điều chỉnh tín hiệu đà liên quan đến biến động thị trường hiện tại.
Một đường tín hiệu — một EMA áp dụng cho các giá trị đã chuẩn hóa — lọc nhiễu và làm mượt các dao động nhỏ.
Để phân biệt các chuyển động yếu và mạnh, công cụ tính toán độ lệch chuẩn lăn (StdDev) trên một cửa sổ nhìn lại và nhân với một hệ số để xác định ngưỡng trên và dưới.
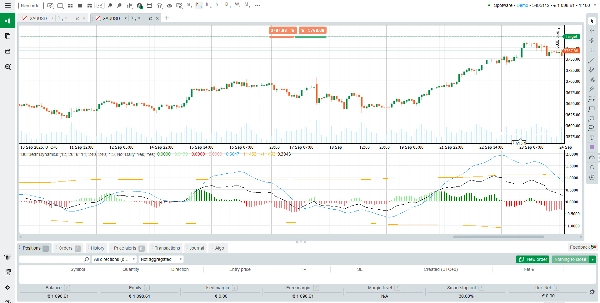
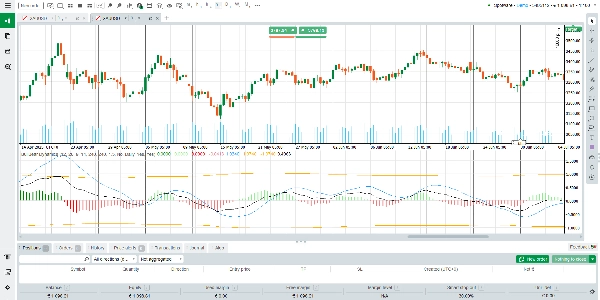
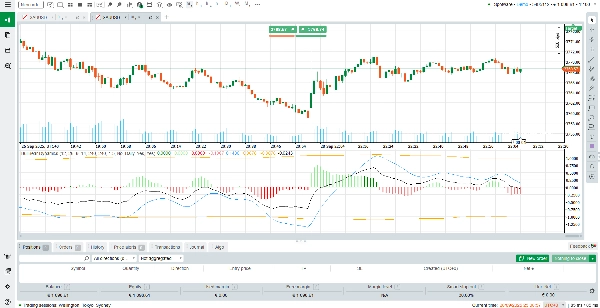
Kết quả cuối cùng được hiển thị dưới dạng biểu đồ cột (với nhiều trạng thái màu sắc) cùng với đường tín hiệu và các giới hạn ngưỡng.
Cách Đọc & Giải Thích Kết Quả
Thanh Biểu đồ (Xanh Lá / Đỏ):
• Màu xanh lá biểu thị đà tăng; màu đỏ biểu thị đà giảm.
• Màu sắc đậm (sáng hơn hoặc đầy hơn) có nghĩa là biểu đồ cột vượt ngưỡng — ngụ ý một chuyển động mạnh.
• Màu sắc nhạt hơn có nghĩa là biểu đồ cột nằm trong giới hạn ngưỡng — ngụ ý đà nhẹ hoặc nhiễu.
Đường Tín hiệu:
• Hoạt động như đường cơ sở tham chiếu.
• Khi biểu đồ cột cắt lên trên đường tín hiệu, điều này báo hiệu đà tăng có thể đang mạnh lên.
• Khi cắt xuống dưới, nó báo hiệu đà giảm có thể đang mạnh lên.
Đường Ngưỡng (Trên & Dưới):
• Các đường nét đứt này xác định các vùng quan trọng.
• Một thanh biểu đồ cột vượt qua ngưỡng biểu thị một chuyển động đà mạnh, độ tin cậy cao.
• Các thanh nằm trong ngưỡng cho thấy phạm vi hoặc sự do dự — tín hiệu kém tin cậy hơn.
Kịch bản & Đọc số:
Đà tăng — các thanh xanh lá trên đường tín hiệu, tốt nhất là cũng vượt ngưỡng trên.
Đà giảm — các thanh đỏ dưới đường tín hiệu, tốt nhất là cũng vượt ngưỡng dưới.
Trung lập / dao động — các thanh dao động trong ngưỡng, màu sắc có thể thay đổi, biên độ nhỏ.
Chuyển đổi hoặc đảo chiều đà — biểu đồ cột cắt đường tín hiệu, kèm theo thay đổi màu sắc; nếu cũng phá ngưỡng, độ tin cậy cao hơn.
Gợi ý Sử dụng & Thực hành Tốt nhất
Sử dụng BullBear Dynamics kết hợp với các công cụ khác (bộ lọc xu hướng, hỗ trợ/kháng cự, phân tích mô hình) để xác nhận.
Cẩn trọng khi giải thích tín hiệu trong các giai đoạn biến động thấp khi các thanh biểu đồ cột nằm trong ngưỡng.
Ưu tiên tín hiệu khi biểu đồ cột cắt đường tín hiệu và phá ngưỡng.
Xác nhận sự đồng thuận hướng trên các khung thời gian cao hơn trước khi hành động theo tín hiệu khung thời gian thấp hơn.
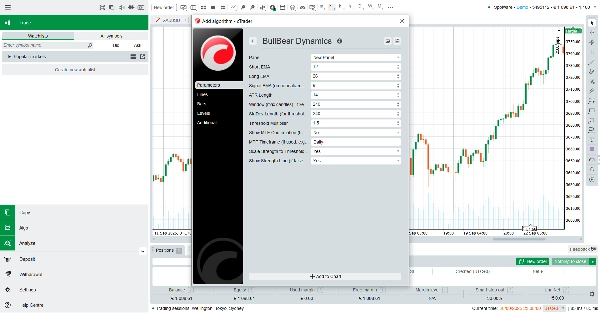
Điều chỉnh các tham số (độ dài EMA, hệ số nhân ngưỡng, cửa sổ StdDev) theo nhu cầu để phù hợp với các thị trường khác nhau (Forex, chỉ số, hàng hóa, tiền điện tử).
Tính Năng & Điểm Nổi Bật Chính
Chuẩn hóa thích ứng với biến động — đà được tỷ lệ theo ATR, giúp tín hiệu đáng tin cậy hơn trong các môi trường thị trường khác nhau.
Ngưỡng động — xây dựng từ độ lệch chuẩn lăn, điều chỉnh theo điều kiện thị trường hiện hành, giúp giảm các phá vỡ giả.
Biểu đồ cột đa màu rõ ràng — phân biệt trực quan giữa đà mạnh và yếu, cũng như đà tăng và đà giảm.
Tương thích rộng — hoạt động trên tất cả các công cụ và khung thời gian được cTrader hỗ trợ.
Miễn phí sử dụng — có sẵn không mất phí; lý tưởng cho các nhà giao dịch muốn có khả năng chỉ báo nâng cao mà không cần đăng ký.
Tóm tắt
The output is displayed as a multi-color histogram with green bars indicating bullish momentum and red bars indicating bearish momentum. The intensity of the colors reflects the strength of the momentum relative to dynamically calculated upper and lower thresholds. The signal line serves as a baseline to identify potential momentum shifts when the histogram crosses it. Threshold lines mark zones of significant momentum moves, with bars crossing these lines signaling stronger trends.
BullBear Dynamics supports all instruments and timeframes available on cTrader, including Forex, commodities, indices, and cryptocurrencies. It is recommended to use this indicator alongside other analysis tools for confirmation and to adjust its parameters to fit different market conditions and trading styles such as scalping.
Đánh giá của khách hàng
5 | 100 % | |
4 | 0 % | |
3 | 0 % | |
2 | 0 % | |
1 | 0 % |


![Logo "[Stellar Strategies] Moving Averages Combined 1.0"](https://cdn.ctrader.com/image/webp/93692c9d-ac16-4dd8-ba83-5a62250c39a9_27250)