
Footprint Chart_noSourceCode
インジケーター
1 購入済
バージョン 1.0、Sep 2025
Windows、Mac
4.3
レビュー: 3
説明
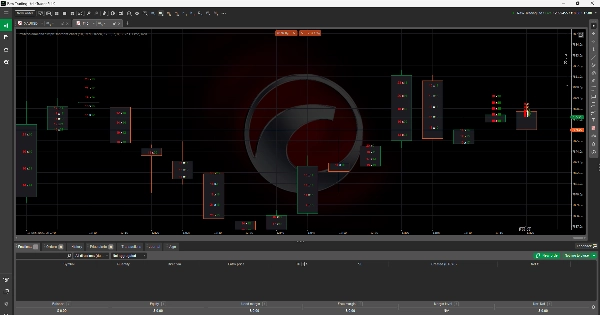
フットプリントチャートインジケーター
フットプリントチャートインジケーターは、各価格キャンドル内に買い注文量と売り注文量を直接表示することで、トレーダーに注文フローの詳細なビューを提供します。従来のローソク足チャートとは異なり、このツールは特定の価格レベルで買い圧力と売り圧力がどこに集中しているかをユーザーが確認できるようにします。買い手と売り手の不均衡を強調することで、市場の深さ、流動性、および取引活動に関するより深い洞察を提供します。これにより、高度な注文フロー分析を通じてエントリー、エグジット、リスク管理を洗練させたいトレーダーにとって不可欠なツールとなっています。
概要
AIによる概要
The Footprint Chart Indicator enhances traditional candlestick charts by displaying bid and ask volumes within each price candle. This visualization allows traders to observe buying and selling pressure at specific price levels, revealing imbalances between buyers and sellers. By providing detailed insights into order flow, market depth, liquidity, and trading activity, the indicator supports more precise trade entries, exits, and risk management decisions. It is applicable across various markets including Forex, cryptocurrencies (e.g., BTCUSD), commodities, indices, and stocks. The tool is designed for traders who utilize advanced order flow analysis to refine their strategies.
インジケーターのプロフィール
カスタマーレビュー
4.3
レビュー: 3
5 | 67 % | |
4 | 0 % | |
3 | 33 % | |
2 | 0 % | |
1 | 0 % |
カスタマーレビュー
September 29, 2025
This fits volume based context better as a review layer. The first forward check can be 97 setups on M1, with 20 reactions and manual notes.
September 26, 2025
More useful for someone who wants less noise in the process. The best use is checking participation and pressure, then leaving the final filter manual.
September 23, 2025
I liked it more as a confirmation layer for volume based context than as something to follow blindly. Pressure is easier to read, and the final decision still feels like it belongs to the trader. Light sizing makes the early sample easier to judge.
ディスカッション
よくあるご質問
BTCUSD
Forex
Signal
Indices
EURUSD
Commodities
GBPUSD
NZDUSD
Prop
Scalping
Crypto
Stocks
XAUUSD
NAS100
USDJPY
cTrader Storeで入手可能な取引ボット、インジケーター、プラグインなどの商品は、第三者の開発者が提供するものであり、情報と技術の取得のみを目的としてご利用いただけます。cTrader Storeはブローカーではなく、投資助言や個人的な推奨を行うことも、将来のパフォーマンスを保証することもありません。
この作成者の他の商品


これも好きかも


価格
登録日 15/01/2025
7
販売