
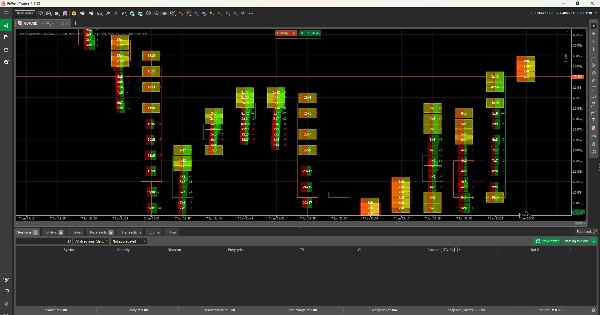
Delta Footprint Bid x Ask
インジケーター
2 購入済
バージョン 2.0、Feb 2026
Windows、Mac
4.5
レビュー: 2
説明
含まれている内容:
- 概要 - インジケーターの機能
- フットプリントコンセプト - フットプリントトレーディングとは何か
- 詳細な計算方法 - ボリュームの計算方法:
-
- 価格レベルの作成
- ボリューム分布アルゴリズム
- 買い/売りの分割ロジック
- 計算例
- ボリューム表示の説明 - 「45x120」の意味
- デルタの解釈 - 正、負、累積
- 主な特徴 - 不均衡、POC、ボリュームバー
- オーダーフロー理論 - ビッドとアスクの説明
- 重要な制限事項 - 実際のティックデータではなく推定であることの正直な説明
- トレーディング応用 - 5つの実際のトレーディングシナリオ
- 設定ガイド - すべてのパラメーターの完全な説明
- タイムフレームの推奨 - さまざまなスタイルに最適な設定
- ヒント&ベストプラクティス
計算に関する重要なポイント:
このドキュメントは明確に説明しています:
ボリュームは推定です - cTraderは実際のティックデータを提供しないため アルゴリズムは賢明です - 複数の要素(ローソク足の種類、価格位置、終値の近接)を使用 パターンは正確です - 相対的な関係は実際のオーダーフローを反映 制限について正直です - 実際の取引所データが必要な場合を説明 正確な計算式を示します - 計算の完全な透明性
これにより、ユーザーは現実的な期待を持ちつつ、インジケーターの価値を強調できます! 📊
概要
AIによる概要
Delta Footprint Bid x Ask is a footprint volume indicator designed to display bid and ask volume splits at each price level. It estimates volume distribution using an intelligent algorithm that incorporates factors such as candle type, price position, and close proximity, as real tick data is not available on the cTrader platform. The indicator provides detailed volume calculations, including price level creation, buy/sell split logic, and example computations, offering transparency through exact formulas. Key features include identification of volume imbalances, point of control (POC), and volume bars, supporting analysis of order flow by comparing bid versus ask volumes. The indicator explains delta values—positive, negative, and cumulative—and offers guidance on settings and timeframe recommendations for various trading styles. It is applicable across multiple markets and symbols, including Forex pairs (EURUSD, GBPUSD, USDJPY, NZDUSD), indices (NAS100, SP500, DAX), commodities (gold, oil, silver), cryptocurrencies (BTCUSD), and stocks. The tool includes practical trading applications and best practices, helping users interpret footprint patterns that realistically mirror order flow despite volume estimates.
インジケーターのプロフィール
カスタマーレビュー
4.5
レビュー: 2
5 | 50 % | |
4 | 50 % | |
3 | 0 % | |
2 | 0 % | |
1 | 0 % |
カスタマーレビュー
January 20, 2026
For volume based context, this feels more useful as a filter than a full system. The journal should cover 55 setups and the trade context.
January 12, 2026
For me the fair test is value area with POC and VWAP. If the result still looks clean, the product becomes easier to trust.
ディスカッション
よくあるご質問
BTCUSD
Forex
Signal
Indices
EURUSD
Commodities
GBPUSD
NZDUSD
Prop
Scalping
Supertrend
Fair Value Gap
Crypto
Stocks
XAUUSD
NAS100
USDJPY
cTrader Storeで入手可能な取引ボット、インジケーター、プラグインなどの商品は、第三者の開発者が提供するものであり、情報と技術の取得のみを目的としてご利用いただけます。cTrader Storeはブローカーではなく、投資助言や個人的な推奨を行うことも、将来のパフォーマンスを保証することもありません。
この作成者の他の商品


価格
登録日 15/01/2025
7
販売