

説明
マーケットプロファイルインジケーター
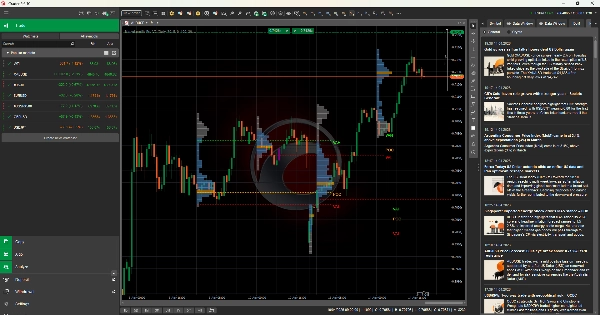
機能 TPO(Time Price Opportunity)ブロックを使用して時間経過に伴う価格分布をマッピングし、市場が最も時間を費やした場所と価格を拒否した場所を明らかにします。
主要な視覚要素 — POC(Point of Control):最も高い出来高/時間の価格レベル — VAH / VAL:バリューエリアの上限と下限(活動の70%) — プロファイル形状:ベルカーブ=バランス、スキュー=トレンド
シグナルと解釈 — 価格がVAHを上回る=強気のブレイクアウトまたはフェードの機会 — 価格がVALを下回る=弱気のブレイクダウンまたは反転のセットアップ — POCは磁石のように機能し、価格はしばしばそこに戻る — 薄いプロファイルゾーン=速い価格変動、受け入れ低
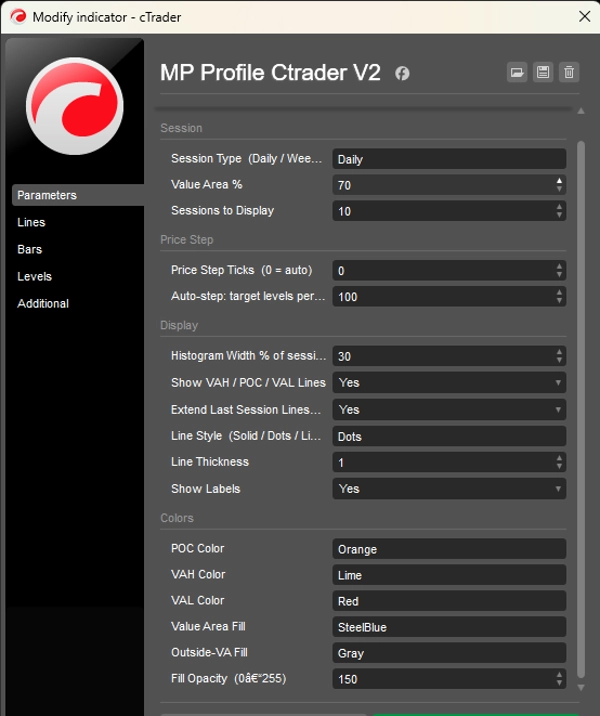
主要設定 — セッションタイプ:RTH / ETH / 週次 — バリューエリア%:デフォルト70% — TPOブロックサイズ:時間枠依存
使用例 — VAH/VALでの高確率の平均回帰エントリーを特定 — 価格がバリューエリアを抜けたときにトレンドのブレイクアウトを確認 — オーバーナイトの参照レベルを使って日中のバイアスを定義
トレーダープロファイル 15分〜4時間のチャートを使用する先物、FX、株式の中級から上級トレーダーに最適です。
制限事項 — 本質的に遅行指標であるため、必ず価格アクションで確認すること — 低出来高またはニュース主導のセッションでは効果が低い
概要
AI summary
Market Profile Pro V2.1 is an indicator that maps price distribution over time using Time Price Opportunity (TPO) blocks to identify where market value is accepted or rejected. It highlights key levels such as the Point of Control (POC)—the price level with the highest volume/time—and the Value Area High (VAH) and Value Area Low (VAL), which represent the upper and lower boundaries containing 70% of trading activity. The profile shape indicates market balance or trend direction.
The indicator provides signals for trading decisions: prices above VAH may indicate bullish breakouts or fade opportunities, while prices below VAL suggest bearish breakdowns or reversal setups. The POC often acts as a magnet, with price tending to rotate back to it. Thin profile zones correspond to rapid price movements with low acceptance.
Key settings include session type selection (Regular Trading Hours, Extended Trading Hours, or Weekly), adjustable Value Area percentage, and TPO block size based on timeframe. It is designed for intermediate to advanced traders using 15-minute to 4-hour charts across futures, forex, and equities markets. Use cases include identifying mean-reversion entries, confirming trend breakouts, and defining intraday bias with overnight reference levels. The indicator is volume-dependent and best used alongside price action confirmation.
The indicator provides signals for trading decisions: prices above VAH may indicate bullish breakouts or fade opportunities, while prices below VAL suggest bearish breakdowns or reversal setups. The POC often acts as a magnet, with price tending to rotate back to it. Thin profile zones correspond to rapid price movements with low acceptance.
Key settings include session type selection (Regular Trading Hours, Extended Trading Hours, or Weekly), adjustable Value Area percentage, and TPO block size based on timeframe. It is designed for intermediate to advanced traders using 15-minute to 4-hour charts across futures, forex, and equities markets. Use cases include identifying mean-reversion entries, confirming trend breakouts, and defining intraday bias with overnight reference levels. The indicator is volume-dependent and best used alongside price action confirmation.
インジケーターのプロフィール
インジケーターのカテゴリー
オーダーフロー/DOM
出力の種類
シグナル
データ要件
取引高
外部データ
ティックデータ
サポート対象のシグナル
ブレイクアウト
クロス
セッション開始レンジ
ラインタッチ
反転
ラインブレイク
カスタマーレビュー
4.0
レビュー: 1
5 | 0 % | |
4 | 100 % | |
3 | 0 % | |
2 | 0 % | |
1 | 0 % |
カスタマーレビュー
April 19, 2026
Market Profile Pro V2.1 provides a solid implementation of TPO-based analysis with POC and value area levels. It offers valuable insights into price distribution and market structure. However, performance issues on lower timeframes and visual glitches with level positioning reduce usability. With optimization and bug fixes, it could become a strong professional tool.
ディスカッション
よくあるご質問
Volume
Market Structure
Support & Resistance
cTrader Storeで入手可能な取引ボット、インジケーター、プラグインなどの商品は、第三者の開発者が提供するものであり、情報と技術の取得のみを目的としてご利用いただけます。cTrader Storeはブローカーではなく、投資助言や個人的な推奨を行うことも、将来のパフォーマンスを保証することもありません。
この作成者の他の商品




![「[Stellar Strategies] Smart ADX」ロゴ](https://cdn.ctrader.com/image/webp/af13b084-b6f6-41db-b7bc-c7e688b57b05_36929)














価格
登録日 15/01/2025
7
販売