
説明
The HAI Quantum V10 は、特に変動の激しい市場で効果的な金融資産のテクニカル分析のために設計された高度なインジケーターです。そのアーキテクチャはアルゴリズムの知能と価格の動きのパターンを組み合わせており、トレーダーがエントリーとエグジットの高確率ゾーンを特定できるようにします。
🔥 市場復帰スペシャル – 限定期間オファー!
休暇は終わり、ビジネスに戻る時です。市場が目覚めると同時に、あなたの戦略も目覚めるべきです。
行動再開を祝して、私の最も強力な取引ツール — HAI Quantum V10 — をわずか $49で提供します。
これは、シーズンを強くスタートしたい真剣なトレーダー向けの限定期間オファーです。エッジを磨くにせよ、信頼できるシステムを探しているにせよ、特別価格で実績のあるインジケーターを手に入れるチャンスです。
✅ ゴールド(XAUUSD)向けに構築 ✅ 複数の時間枠でテスト済み ✅ トレーダーによるトレーダーのための設計
迷わないで — このオファーは長く続きません。 自信と精度を持ってゲームに戻りましょう。
当製品は、包括的な市場の視点を提供するために一連の主要なインジケーターを統合しています:
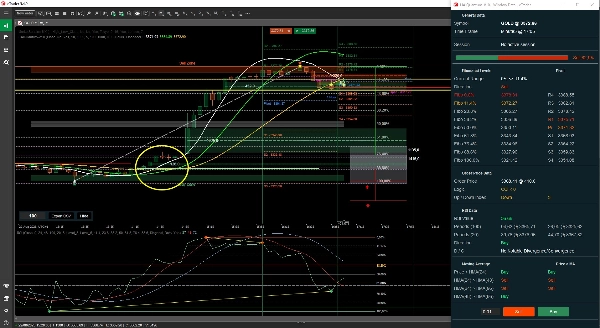
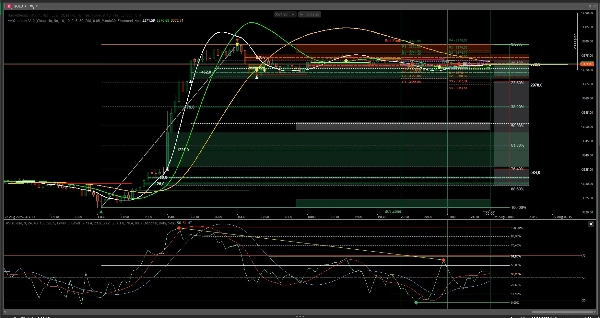
- レンジボックスフィボナッチ(当社独自開発): フィボナッチレベルに基づいて潜在的なサポートおよびレジスタンスゾーンを特定するのに役立つユニークなツールです。
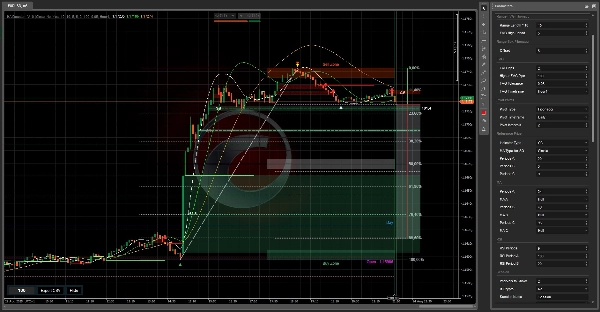
- 主要参照価格: 3つのカスタマイズ可能なインジケーター(CCI、ストキャスティクス、RSI)の合流点から重要な価格ポイントを決定します。これらのポイントはエントリーとエグジットの機会を特定するのに役立ちます。
- 3つの設定可能な移動平均線: トレンドの確認や価格方向の変化検出に最適な移動平均線を選択できます。
- RSI: より正確な価格変動予測のために。選択された期間の高値と安値を含みます。ビジュアルには含まれていません。
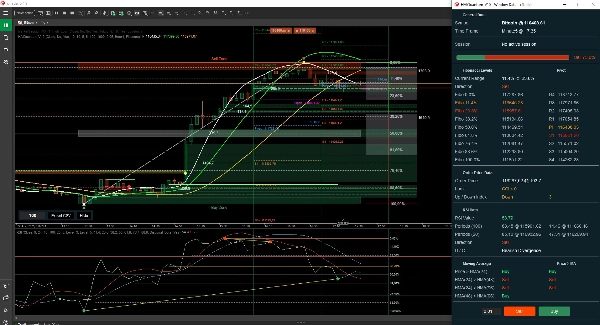
HAI Quantum はこれらのインジケーターからデータを収集・処理し、2つの視覚化方法を提供します:
- マニュアルモード: 各インジケーター設定に基づいて価格が上昇傾向か下降傾向かを要約した明確で簡潔なウィンドウ。
- フィボナッチおよびピボットレベルを強調表示した新しいデータウィンドウ: この新バージョンでは、FVG(フェアバリューギャップ)を統合しており、サイズやフィボナッチまたはピボットレベルへの近接度でフィルタリング可能で、画像に示されているように緩和ポイントも表示されます。
概要
インジケーターのプロフィール
カスタマーレビュー
5.0
レビュー: 1
5 | 100 % | |
4 | 0 % | |
3 | 0 % | |
2 | 0 % | |
1 | 0 % |
カスタマーレビュー
August 28, 2025
Innovative algorithm, useful for trend/reversal detection. Indicator can be a valuable addition for advanced traders willing to test and fine-tune it. However, it should not be relied upon as a standalone signal provider, but rather as a complementary tool in a broader strategy.I loved it
ディスカッション
よくあるご質問
BTCUSD
Forex
Signal
Breakout
Indices
EURUSD
Commodities
GBPUSD
NZDUSD
RSI
Martingale
Prop
Scalping
Supertrend
Crypto
Stocks
AI
XAUUSD
NAS100
MACD
USDJPY
cTrader Storeで入手可能な取引ボット、インジケーター、プラグインなどの商品は、第三者の開発者が提供するものであり、情報と技術の取得のみを目的としてご利用いただけます。cTrader Storeはブローカーではなく、投資助言や個人的な推奨を行うことも、将来のパフォーマンスを保証することもありません。


これも好きかも


価格
147
販売
11.18K
無料インストール