
ЧТО ОН ДЕЛАЕТ
Structural Supertrend решает фундаментальное ограничение классического Supertrend: он меняет направление в тот момент, когда цена закрывается за пределами своей полосы.
В чистых трендах это работает хорошо. В условиях высокой волатильности или флетового рынка один агрессивный свечной бар может вызвать смену направления — даже когда более широкий тренд остается структурно неповрежденным. Результатом становятся ложные сигналы, преждевременные выходы и повторные входы по худшим ценам.
Этот индикатор построен на другой предпосылке.
Смена направления происходит только тогда, когда цена подтверждает подлинное структурное изменение — а не просто моментальное закрытие за пределами порога. Результат — меньше ложных разворотов и лучшее соответствие тому, как тренды действительно развиваются.
Supertrend становится структурным. Сигналы становятся значимыми.
ПОЧЕМУ STRUCTURAL SUPERTREND?
Проблема
Оригинальный Supertrend рассматривает каждое закрытие за пределами своей полосы как разворот. Это сделано намеренно — чтобы индикатор был реактивным по своей природе. Но реактивность имеет свою цену.
Во время фаз консолидации цена часто закрывается за одной полосой, а затем сразу же разворачивается. Каждое такое событие генерирует сигнал смены направления, каждая смена представляет потенциальное торговое решение, и каждая означает выход из позиции, который не был необходим.
Трейдеры, которые долго использовали Supertrend, хорошо знакомы с этим разочарованием.
Решение
Structural Supertrend расширяет оригинальную модель, чтобы различать закрытия, вызванные волатильностью, и подлинные изменения направления. Он фильтрует шум, требуя структурного подтверждения перед сменой направления тренда.
Меньше смен направления. Лучшее соответствие тренду. Меньшая реактивность на отдельные свечи.
Зачем оставлять оба?
Оригинальный Supertrend по-прежнему отображается на графике — но только там, где он отличается от Structural. Это сделано намеренно.
- Structural отслеживает основное направление тренда
- Original показывает импульсное и коррекционное поведение внутри этого тренда
Когда оба совпадают: сильное направление с высокой уверенностью. Когда они расходятся: движение, скорее всего, коррекционное, а не настоящий разворот. Этот двухслойный взгляд дает контекст, который ни одна линия по отдельности не может предоставить.
ИНТЕГРИРОВАННОЕ ОБНАРУЖЕНИЕ СВИНГОВ
Structural Supertrend включает полный механизм обнаружения свингов и систему уровней поддержки/сопротивления — не как второстепенную функцию, а как прямое расширение структурного анализа.
Свинг определяется через процесс квалификации, ориентированный на структуру: каждый кандидат оценивается по смещению, подтверждению объемом и расстоянию относительно ATR перед принятием. Это позволяет сосредоточить карту свингов на значимых точках разворота, а не на каждом локальном экстремуме.
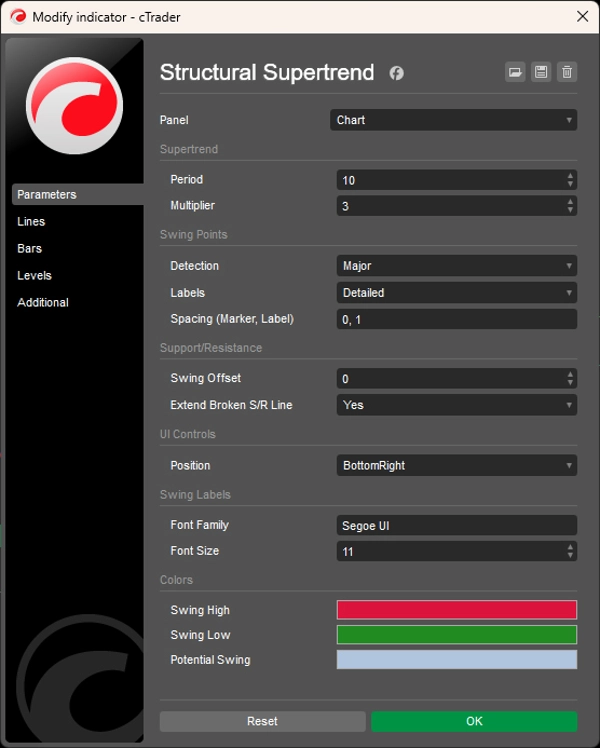
Три режима обнаружения
- Minor — повышенная чувствительность, захватывает внутренние свинги внутри трендов
- Balanced — отфильтрованная детализация, подходит для большинства случаев
- Major — только самые сильные структурные повороты, подтвержденные более широкими критериями
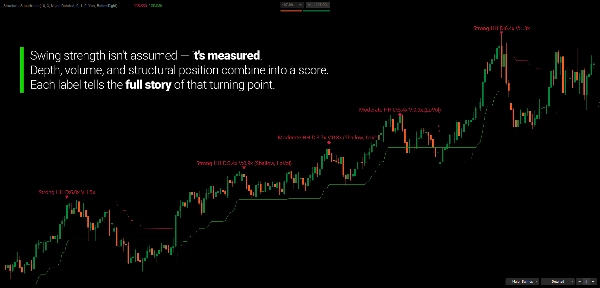
Классификация силы свингов
Каждый подтвержденный свинг оценивается по глубине, объему и структурному положению относительно предыдущего свинга того же типа. Сила классифицируется динамически с использованием процентильного ранжирования на основе недавней истории свингов — а не фиксированных порогов. Визуальные маркеры отражают классификацию: треугольники для сильных, ромбы для умеренных, круги для слабых.
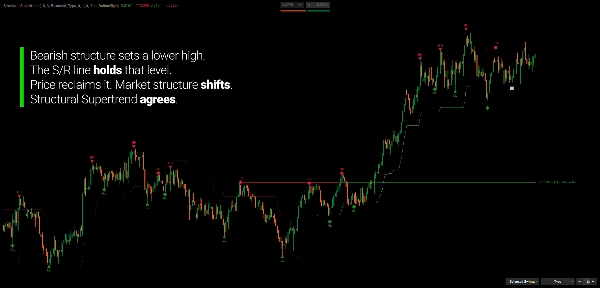
Зоны поддержки/сопротивления с отслеживанием полярности
Подтвержденные свинги становятся активными уровнями поддержки/сопротивления, которые отслеживают свою историю взаимодействия. Когда цена повторно достигает уровня, индикатор фиксирует, был ли контакт отторжением фитиля или пробоем тела свечи. Когда уровень пробивается и закрывается за ним, полярность меняется — бывшее сопротивление становится поддержкой и наоборот. Если уровень пробивается снова, зона становится недействительной.
Метки возраста показывают, как долго каждый уровень активен и сколько раз он был протестирован.
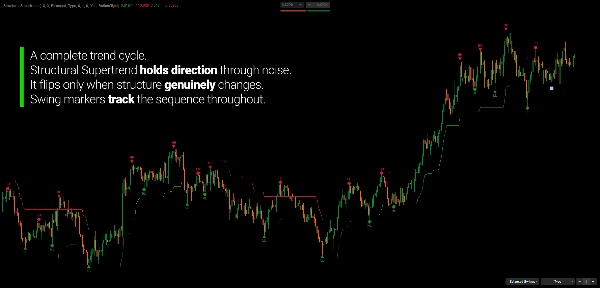
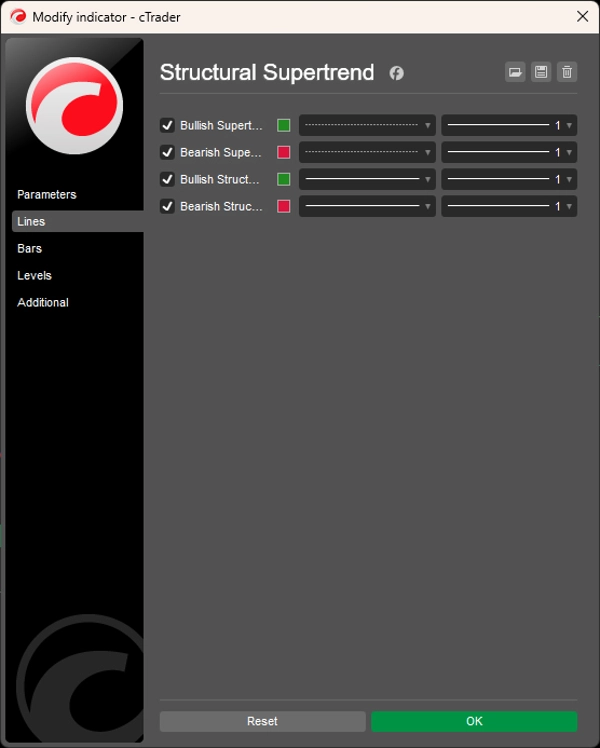
ЧТЕНИЕ ГРАФИКА
- Зеленая линия структуры: Бычий структурный тренд (динамическая поддержка)
- Красная линия структуры: Медвежий структурный тренд (динамическое сопротивление)
- Пунктирная линия: Оригинальный Supertrend — виден только там, где отличается от Structural
- Линии поддержки/сопротивления: Активные уровни с состоянием полярности и возрастом
Проверка согласованности тренда:
- Структура + Оригинал совпадают → Сильное направленное движение с высокой уверенностью
- Структура + Оригинал расходятся → Вероятно коррекционная или переходная фаза
ДЛЯ КОГО ОН
Этот индикатор предназначен для трейдеров, которые хотят читать направление тренда и структуру рынка из единой, связной системы.
Если вы использовали классический Supertrend и считали его слишком реактивным — часто меняющим направление в боковых условиях — Structural Supertrend создан именно для решения этой проблемы.
Он хорошо подходит для трендовых и свинг-трейдеров, которые хотят более чистое направление без постоянных ложных разворотов, структурных трейдеров, отслеживающих последовательности свингов для подтверждения здоровья тренда, и дискреционных трейдеров, использующих уровни поддержки/сопротивления как контекст для входов, выходов и управления позициями.
Встроенные элементы управления интерфейсом делают его удобным для использования в реальном времени: переключайте режимы обнаружения, настраивайте уровни поддержки/сопротивления и переключайте детализацию меток прямо на графике — без необходимости открывать панель настроек.
Это не генератор сигналов. Это структурная аналитическая система для трейдеров, которые хотят понимать, где находится рынок, а не только что он делает прямо сейчас.
ЧТО ДЕЛАЕТ ЕГО ОСОБЕННЫМ
Большинство реализаций Supertrend рассматривают каждое закрытие за пределами полосы как сигнал к действию. Этот же рассматривает его как кандидат и требует структурных доказательств перед сменой направления.
Большинство детекторов свингов определяют локальные максимумы и минимумы без критериев оценки. Этот квалифицирует каждый свинг по смещению, объему и структурному положению — и динамически оценивает силу на основе недавней истории свингов.
Большинство инструментов поддержки/сопротивления просто рисуют линию и оставляют ее. Этот отслеживает историю взаимодействий, отмечает изменения полярности и продолжает развиваться по мере того, как рынок повторно посещает каждый уровень.
Результат: инструмент тренда и структуры, который остается актуальным дольше, меньше реагирует на шум и строит более богатую картину состояния рынка со временем.
---
ПОНИМАНИЕ СТРУКТУРНОГО АНАЛИЗА
Структура рынка — это не поиск «правильного» свинга или «корректного» направления тренда. Это поддержание объективной картины того, как развиваются последовательности цен — и сохраняется ли эта последовательность целостной или начинает разрушаться.
Тренд определяется не одним движением, а серией взаимосвязей: более высокими максимумами и минимумами в восходящих трендах, более низкими максимумами и минимумами в нисходящих. Каждый новый свинг либо подтверждает, либо ставит под сомнение существующую последовательность. Когда подтверждение продолжается, структура сохраняется. Когда оно нарушается, структура переходит в состояние изменения.
Полезность структурного анализа заключается не в том, что он предсказывает, куда пойдет цена, а в том, что он описывает, где цена находится в своей последовательности в данный момент. Это важное различие. Прогноз требует предположений о будущем. Структурное наблюдение требует только точного чтения того, что уже произошло.
Индикаторы, построенные на структурной логике, предназначены для поддержки этого наблюдения — чтобы сделать последовательность видимой и отслеживаемой без субъективной интерпретации. Цель — ясность текущего состояния рынка, а не уверенность в будущем направлении цены.
---
Торговля связана с риском. Этот индикатор является инструментом технического анализа — всегда применяйте надлежащее управление рисками.
5 | 67 % | |
4 | 33 % | |
3 | 0 % | |
2 | 0 % | |
1 | 0 % |


![Логотип продукта "[Stellar Strategies] MARSI Signal Plotter"](https://cdn.ctrader.com/image/webp/7b2b8da6-8f8e-4646-8d4a-4710c516c01e_25567)


