
Описание
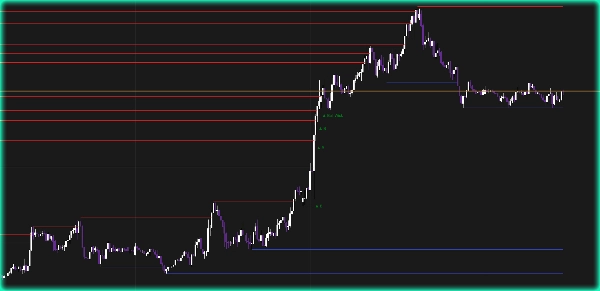
Уровни поддержки и сопротивления с пробоями от [BeyondTrading] — видьте каждый живой уровень и каждый реальный пробой. Автоматически определяет локальные максимумы и минимумы и рисует горизонтальные линии поддержки и сопротивления прямо на графике. Каждая линия продолжается бар за баром в реальном времени, пока уровень держится. В момент закрытия цены через него линия останавливается — точно в точке контакта. Никаких ручных построений, никаких устаревших уровней, загромождающих ваш график.
Когда уровень пробивается, сразу появляется сигнал: B для чистого пробоя с объемом, Bull Wick или Bear Wick когда закрытие происходит за счет фитиля, а не реального закрытия тела свечи. Фильтр объема исключает малозначимые движения и оставляет только важные сигналы.
Почему уровни поддержки/сопротивления важны Уровни поддержки и сопротивления — это не просто линии, это ликвидные зоны. Каждый раз, когда цена отскакивала от уровня, стоп-ордера и отложенные ордера накапливаются чуть выше и чуть ниже него. Когда цена возвращается, институциональные игроки либо защищают уровень, либо охотятся за стопами, прежде чем начнется реальное движение. Уровень сопротивления, который был протестирован трижды и не пробит, не случаен — именно там сосредоточены ордера на продажу и где трейдеры на пробой окажутся в ловушке, если движение ложное. Знание того, какие уровни еще активны, а какие уже пробиты, точно подскажет, где вероятна следующая реакция.
Особенности
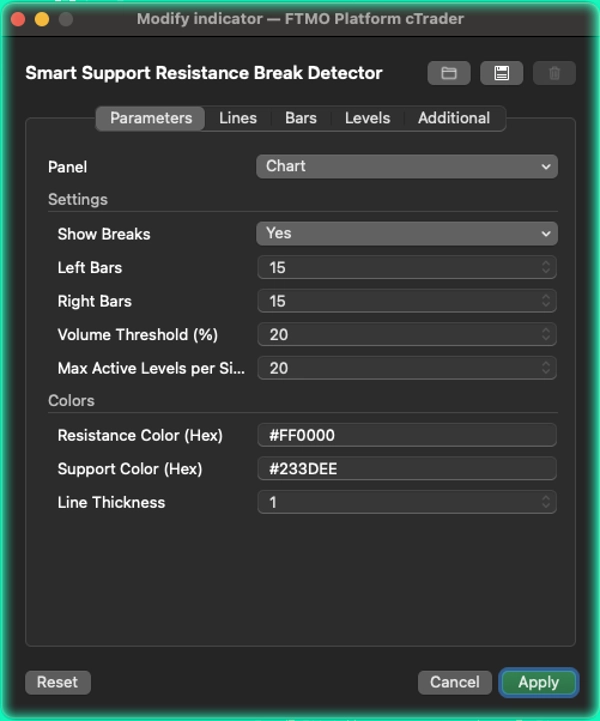
- Определение пивотов с настраиваемыми левыми и правыми барами для любого стиля торговли
- Линии динамически продолжаются на каждом баре — они останавливаются в момент закрытия цены через них
- Фильтр объема (осциллятор EMA 5/10) для различения реальных пробоев и шума
- Метки пробоев: B для чистых пробоев с объемом, Bull Wick и Bear Wick для движений, вызванных фитилем
- Фильтрация дубликатов — уровни, слишком близкие к существующим, автоматически игнорируются
- Максимальное количество активных уровней с каждой стороны для чистоты и читаемости графика
- Полностью настраиваемые цвета сопротивления и поддержки с вводом в формате hex
Сводка
The indicator features volume-confirmed break signals to distinguish genuine breakouts from low-conviction moves. It displays specific labels: "B" for clean volume breaks, and "Bull Wick" or "Bear Wick" when breaks are driven by wicks rather than body closes. A volume filter based on EMA oscillators helps filter out noise.
Additional functionalities include configurable pivot detection parameters (Left Bars and Right Bars), automatic filtering of duplicate levels, and limits on the maximum number of active levels per side to maintain chart clarity. Users can customize support and resistance line colors using hex codes.
This tool is designed to highlight key liquidity pools where institutional orders accumulate, aiding traders in identifying active levels and potential reaction points in the market.


